
Ethnic diversity in fertility treatment 2018
UK ethnicity statistics for IVF and DI fertility treatment
Published: March 2021
Download the underlying dataset as .xlsx (27kb).
Table of contents
- Main points
- Introduction
- Section 1. IVF birth rates lowest for patients of Black ethnicities
- Section 2. Multiple birth rate higher on average for Black patients
- Section 3. White egg donors most commonly used across all ethnic groups
- Section 4. Fewer Asian egg and sperm donors compared to UK Asian population
- Section 5. Asian patients represent a larger proportion of IVF users
- Section 6. Variation in NHS-funded IVF cycles between cycles in larger in younger age groups
- Section 7. Black patients start IVF later than other ethnic groups
- Section 8. Female same-sex relationships are more common among patients of White and Mixed ethnicities
- Conclusion and next steps
- About our data
Introduction
In 2018, about 54,000 patients had a total of 68,724 in vitro fertilisation (IVF) and 5,651 donor insemination (DI) treatments in licensed fertility clinics across the UK1 – this report looks at how access to, and outcomes of fertility treatment, differed by ethnic group.
Ethnic comparisons are limited by the data we hold on our Register and there are a number of external factors that contribute to the differences we outline in this report, such as socioeconomic status, which is shown to impact rates of pre-existing health conditions.
Where possible we have added in broad interpretations of why disparities may exist and have included references to peer-reviewed academic or other publications that provide further information.
Five aggregated ethnic categories have been used throughout this report (Asian, Black, Mixed, Other and White – as used in the 2011 Census of England and Wales2) to allow for more reliable comparisons across ethnicities. These are broad categories and encompass a wide range of ethnicities. However, differences may exist within the major categories and some data is available on more specific ethnic categories in the underlying dataset. Where the numbers in a single year are too small for robust estimates by ethnicity, we have aggregated the data by up to five years.
In the concluding section, we have outlined a number actions we will take to address the issues raised in the report.
Main points
- This report highlights disparities in access to and outcomes of fertility treatment by ethnic group from 2014-18 and actions for the HFEA and others to undertake in response.
- Black patients had lower IVF birth rates: for Black patients aged 30-34, the birth rate per embryo transferred was on average 23% compared to Mixed and White patients at 30% from 2014-2018.
- Black patients reported higher rates of tubal factor infertility, accounting for 31% of patient-based infertility compared to the 18% average from 2014-2018.
- Black patients had the highest multiple birth rates of any ethnic groups at 14%, compared to a national average of 12% from 2014-2018.
- Black patients generally started IVF at later ages than other ethnic groups at an average age of 36.4, compared to the national average of 34.6 in 2018.
- Asian patients represented a larger proportion of IVF users at 14% of IVF patients in 2018 compared to 7% of the UK population, but a smaller proportion of DI users at 3%.
- Asian donors accounted for 4% of egg donors and 5% of sperm donors, compared to 7% of UK population and 14% of IVF patients in 2018.
- White egg donors were most commonly used among most ethnic groups, with White egg donors used in 98% of cycles with a White patient, 59% of cycles with a Mixed patient, and 52% of cycles with an Asian patient.
- Sperm donations from Mixed (76%), Other (64%) and Black (63%) donors were more likely to be imported from 2014-2018.
- White and Mixed ethnicity IVF patients were more commonly in female same-sex relationships than other ethnic groups.
- There was some variation in NHS-funded IVF cycles across ethnic groups, particularly in younger patient age groups.
1. IVF birth rates lowest for patients of Black ethnicities
IVF birth rates per embryo transferred reached a record average high of 23% in 20181, but this varies by patient ethnic group. From 2014-2018, birth rates were typically lower among Black patients, particularly patients identifying as Black African. Asian patients also commonly had lower birth rates, mainly among South Asian patients. In contrast, higher birth rates were recorded for White and Mixed ethnicity patients. These findings are consistent with previous research using UK and United States (US) data3-4.
To account for age differences across ethnic groups, we have compared birth rates by patient age at treatment. As shown in Figure 1, Black patients aged 30-34 had average birth rates per embryo transferred of 23%, compared to Mixed and White patients with average birth rates of 30%. Variations in birth rates across ethnic groups continue into older ages, though the margin in difference decreases in patients over 40 years of age. Differences across ethnicities were consistent when using other birth rate or pregnancy rate measures (see underlying dataset).
The reasons for these variations are not certain but may relate to several factors, including socioeconomic related pre-existing health conditions such as obesity. Obesity impairs ovarian response to stimulation drugs, ultimately resulting in fewer mature follicles5. Endometrial receptivity may also vary by ethnicity, and fibroids are three times more common in the Black population and are associated with reduced IVF success6.
Figure 1. IVF birth rates lower for Black and Asian patients
IVF birth rates per embryo transferred using patient eggs by age and ethnicity, 2014-2018 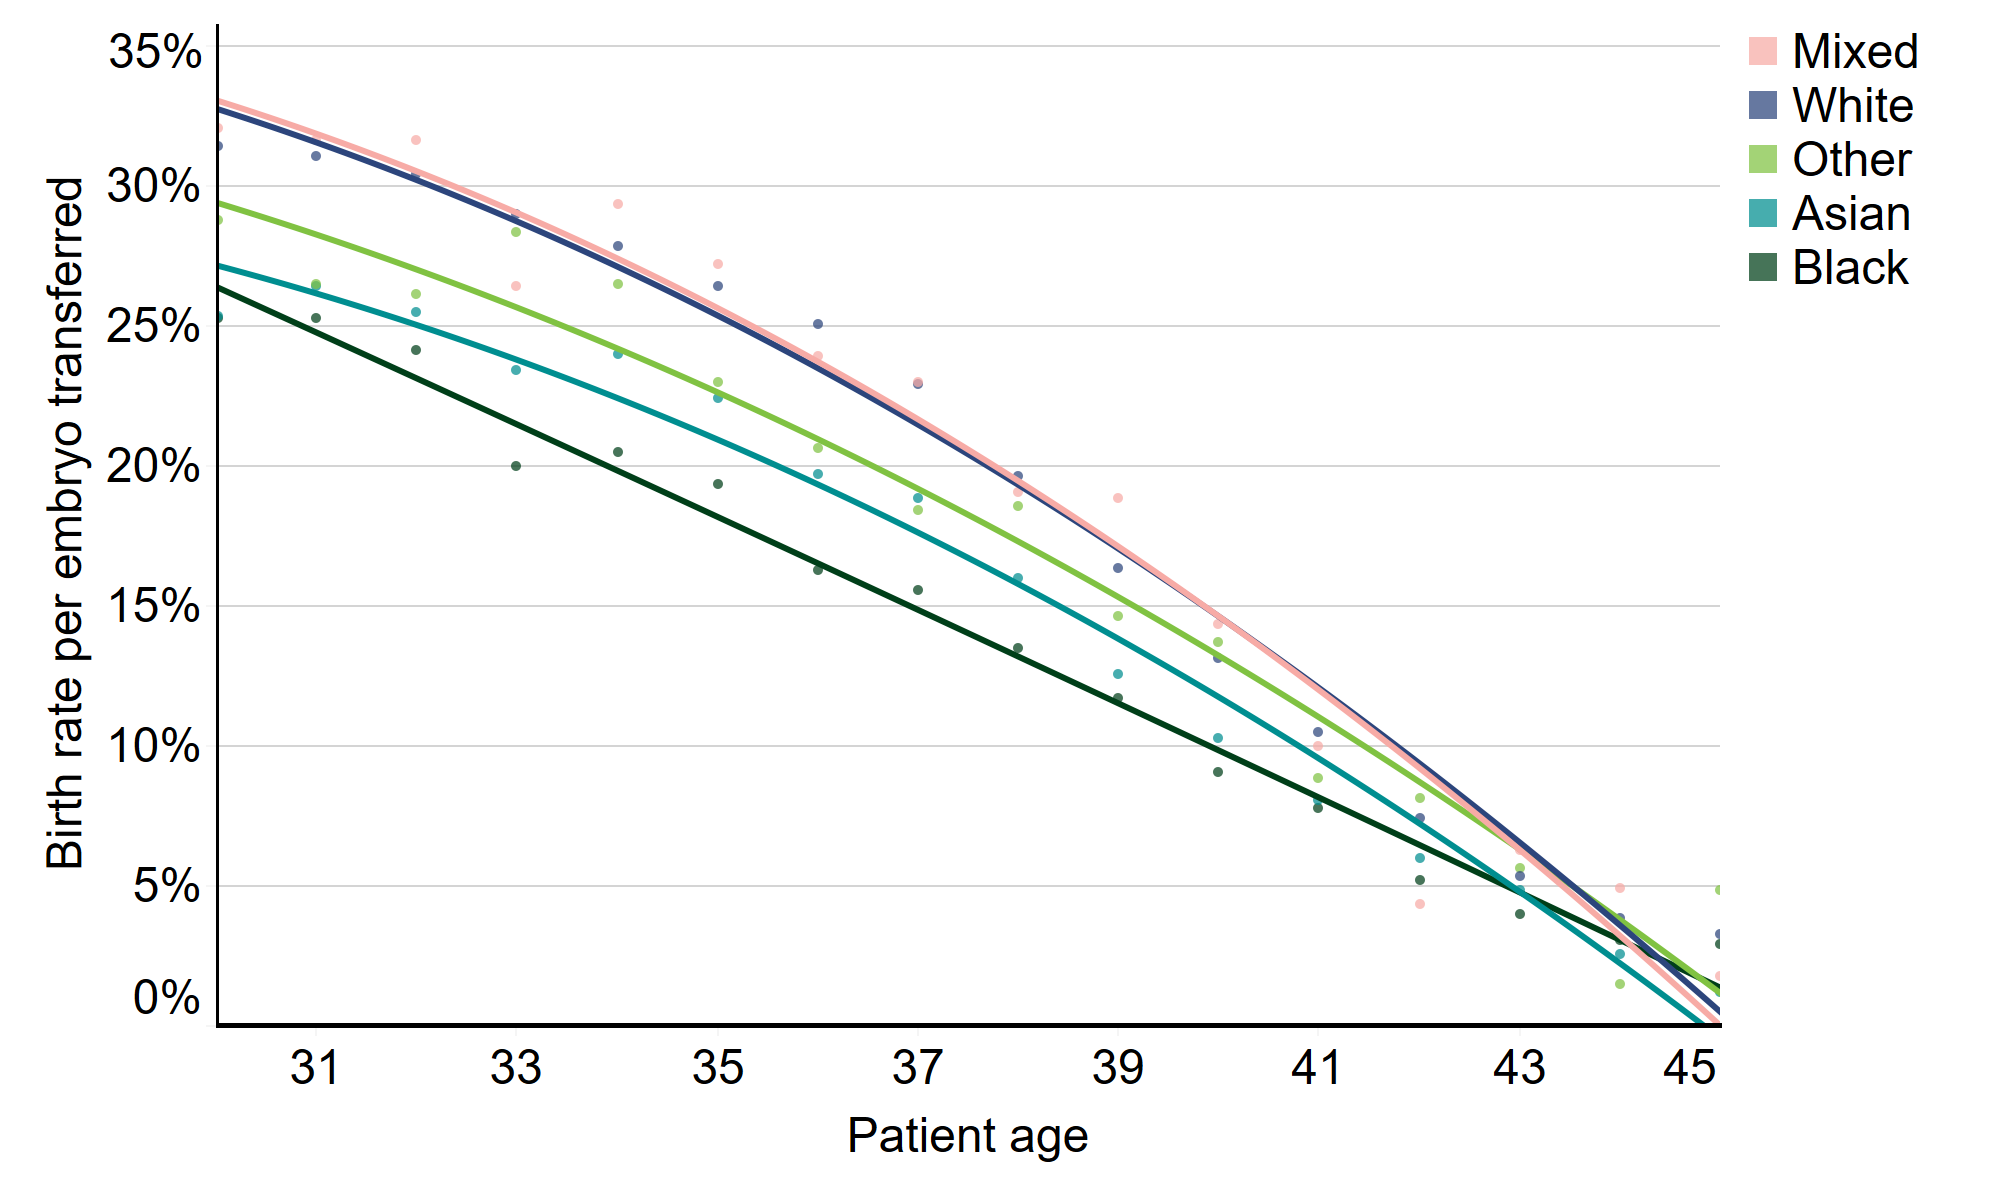
Download the underlying data for Figure 1. (xlxs 12kb)
Note figure 1: This data excludes cycles using donor eggs, PGD, PGT-A, or surrogacy, and cycles where a pregnancy was recorded but not the outcome. Lines included in the graph are lines of best fit and circles represent the average birth rate at individual patient ages.
Another possible factor to consider in birth rate disparities is the difference in types of patient-based infertility recorded across ethnic groups (Figure 2). Higher rates of tubal factor infertility were recorded among Black patients (31%) compared to the average (18%). This is consistent with research in the US which reported higher rates of tubal disorder among Black patients and recorded poorer birth outcomes7. It is also worth noting the lower rates of patient unexplained infertility at 42% among Black patients compared to 51% on average from 2014-2018. Research has shown higher chances of spontaneous conception while awaiting fertility treatment for patients with unexplained infertility compared to other types of infertility8.
Asian patients had the highest rates of ovulatory disorder at 25%, compared to the average of 20%. Higher rates of ovulatory disorder among Asian patients have been reported in research and associated with lower pregnancy rates9.
Figure 2. Tubal disease more prevalent among Black patients
Proportion of patient-based infertility by ethnicity, 2014-2018 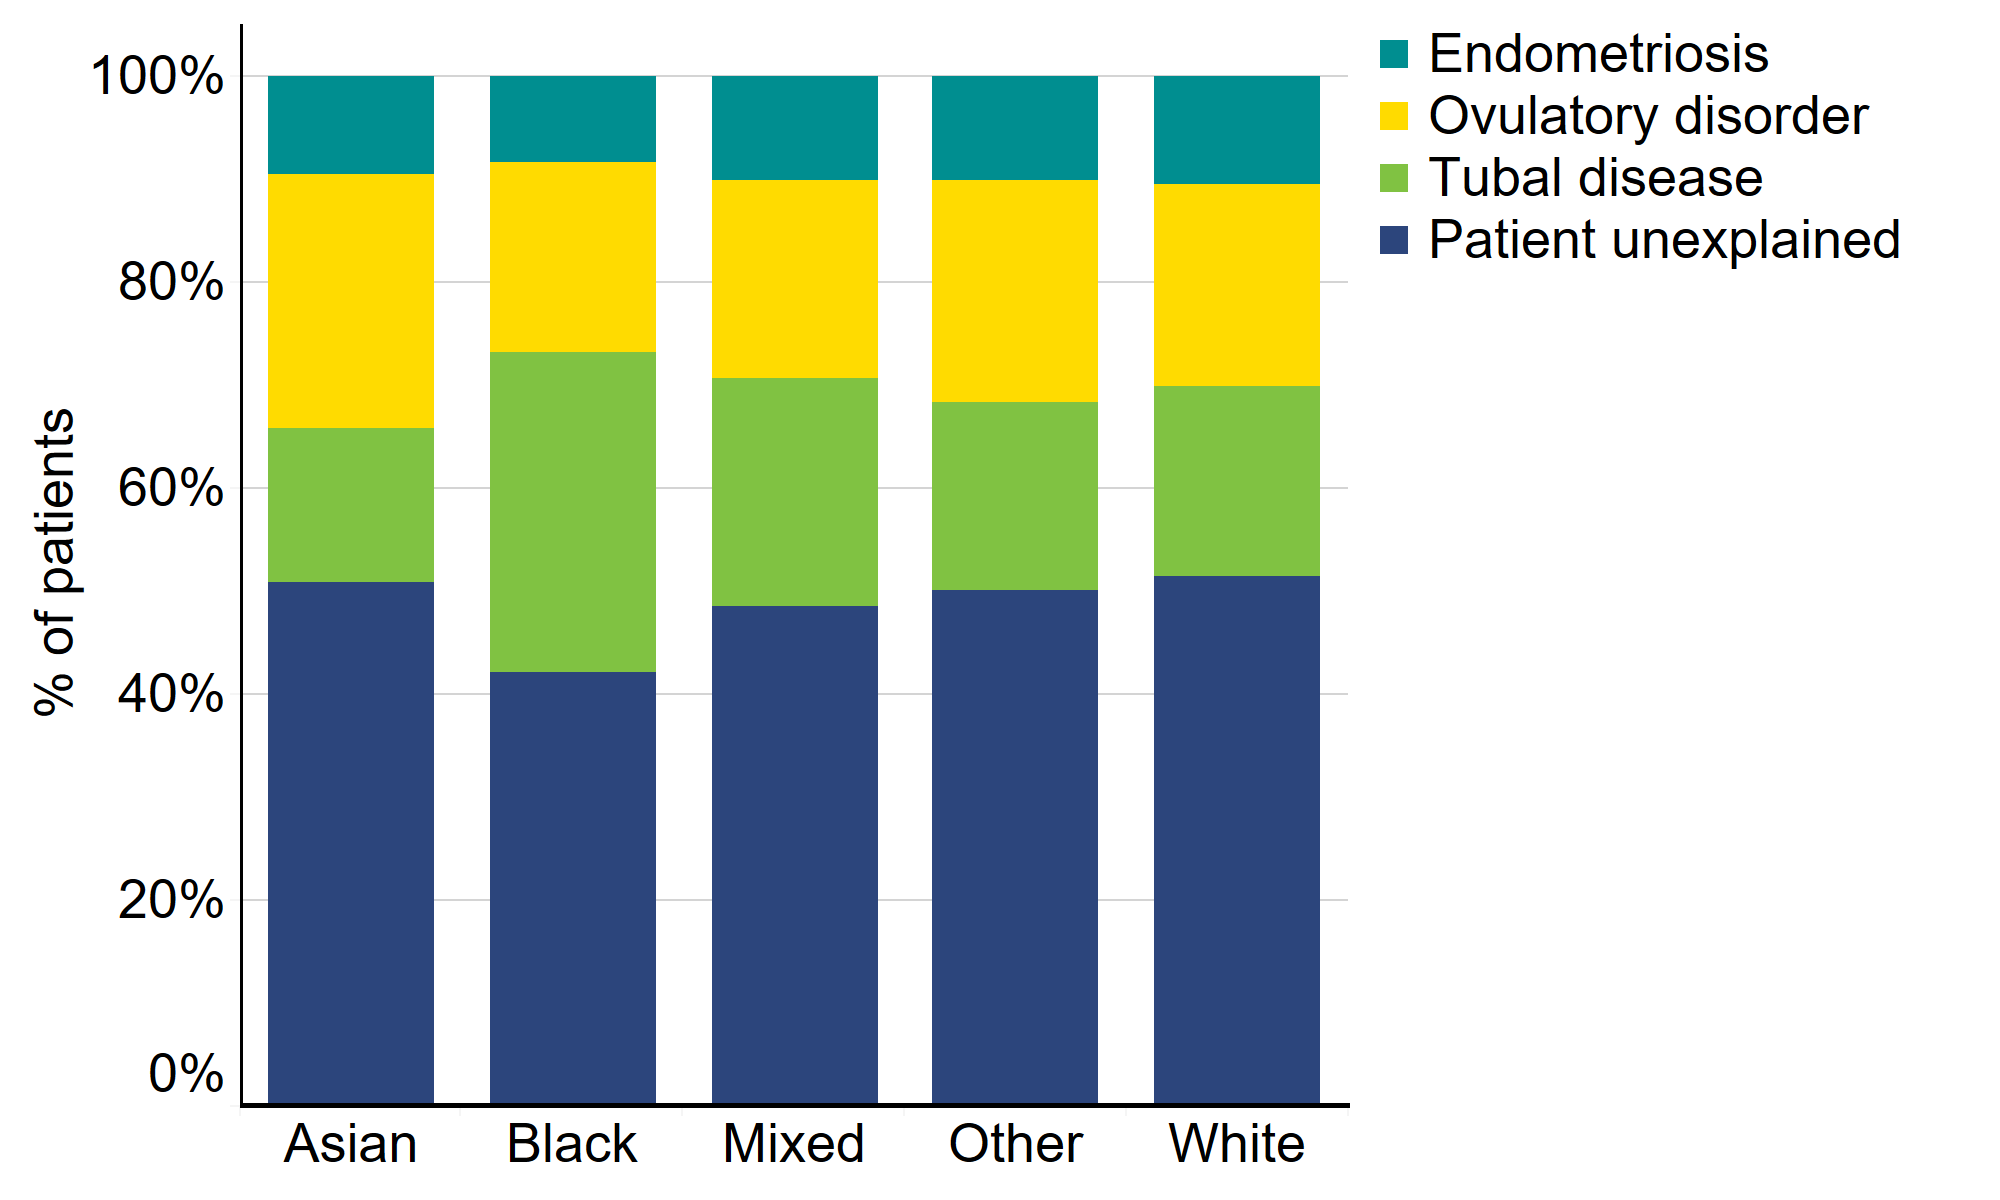
Download the underlying data for Figure 2. (xlxs 12kb)
Note figure 2: Male infertility is similar across patient ethnic groups, therefore only patient-based infertility is included in the above figure for simplicity. Cycles with no recorded infertility, PGD, PGT-A and surrogacy cycles were excluded.
2. Multiple birth rate higher on average for Black patients
Multiple births are the single biggest health risk of fertility treatment for both patients and babies. Patients having a multiple birth are at an increased risk of miscarriage, high blood pressure, pre-eclampsia, gestational diabetes, caesarean section and the risk of maternal mortality is increased by 2.5 times. Multiple births also increase the risk of premature birth by six times, which can lead to long-term health problems such as difficulty breathing, cerebral palsy and other physical and learning difficulties10-12.
Following sector-wide changes to practice, IVF multiple birth rates have decreased over the last decade from about 26% in 2008 to 8% in 20181. Figure 3 shows that the multiple birth rate varies by ethnicity with Black patients having experienced higher than average multiple births, at around 14% from 2014-2018. Multiple birth rates were 11% for Mixed, White and Asian patients, while the multiple birth rate for Other patients was 13% from 2014-2018. These variations likely relate to use of multiple embryo transfers in clinical practice.
Maternal mortality rates are low in the UK (9.2 in 100,000 pregnancies) but Black women are at a five times greater risk than White women of dying during pregnancy. While advanced age and pre-existing heart conditions are major factors in mortality risk, multiple pregnancies were directly or indirectly related to nine of the 209 maternal deaths from 2015-201713. The higher age of Black IVF patients (section 7) and the higher prevalence of heart conditions in the Black population14, mean that it is particularly important that risks should be seriously considered prior to using multiple embryo transfers.
Figure 3. Multiple birth rates highest on average for patients of Black ethnicities
Average multiple birth rate by patient ethnicity, 2014-2018 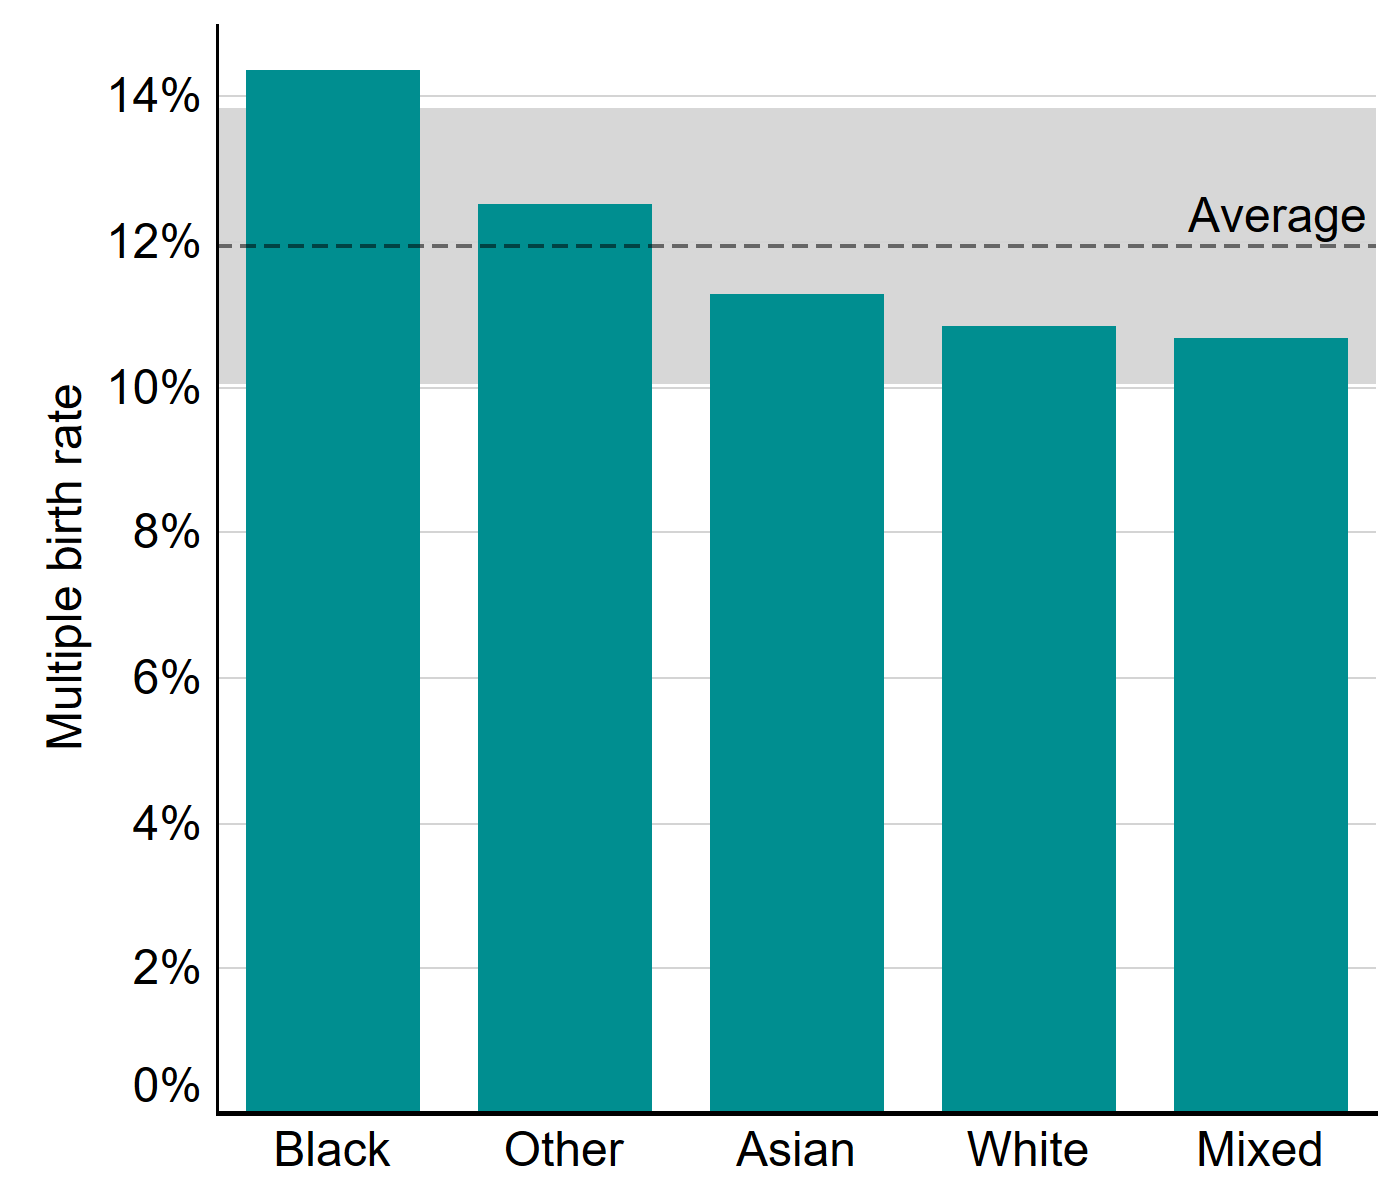
Download the underlying data for Figure 3. (xlxs 12kb)
Note figure 3: cycles where a pregnancy was recorded but not the outcome have been excluded. Average multiple birth rate (dashed line) only includes cycles with listed ethnicity. Grey shading represents 95% confidence interval.
Multiple births were much more common when multiple embryos were transferred (26%) compared to only one (1%) in 20181. Multiple embryo transfers have reduced from 83% of IVF cycles in 2008 to 29% of cycles in 2018. In Figure 4, we compare multiple embryo transfers from 2014-2018 by ethnic group.
Black patients had the highest rate of multiple embryo transfer (46% of cycles), while White patients had the lowest (38%) from 2014-2018. Patients of Other ethnicities had the second highest rate of multiple embryo transfers at 45% of cycles, followed by Mixed patients at 41% and Asian patients at 39% of cycles.
The higher rates of multiple embryo transfers among Black patients may relate to advanced age and reduced embryo quality due to delayed treatment (section 7). The use of multiple embryo transfers may also relate to cost, as some US studies have suggested that patients choose elective single-embryo transfer more frequently when cost pressure is reduced15.
Figure 4. Multiple embryo transfers more common among Black patients
Proportion of single and multiple embryo transfers by patient ethnic groups, 2014-2018 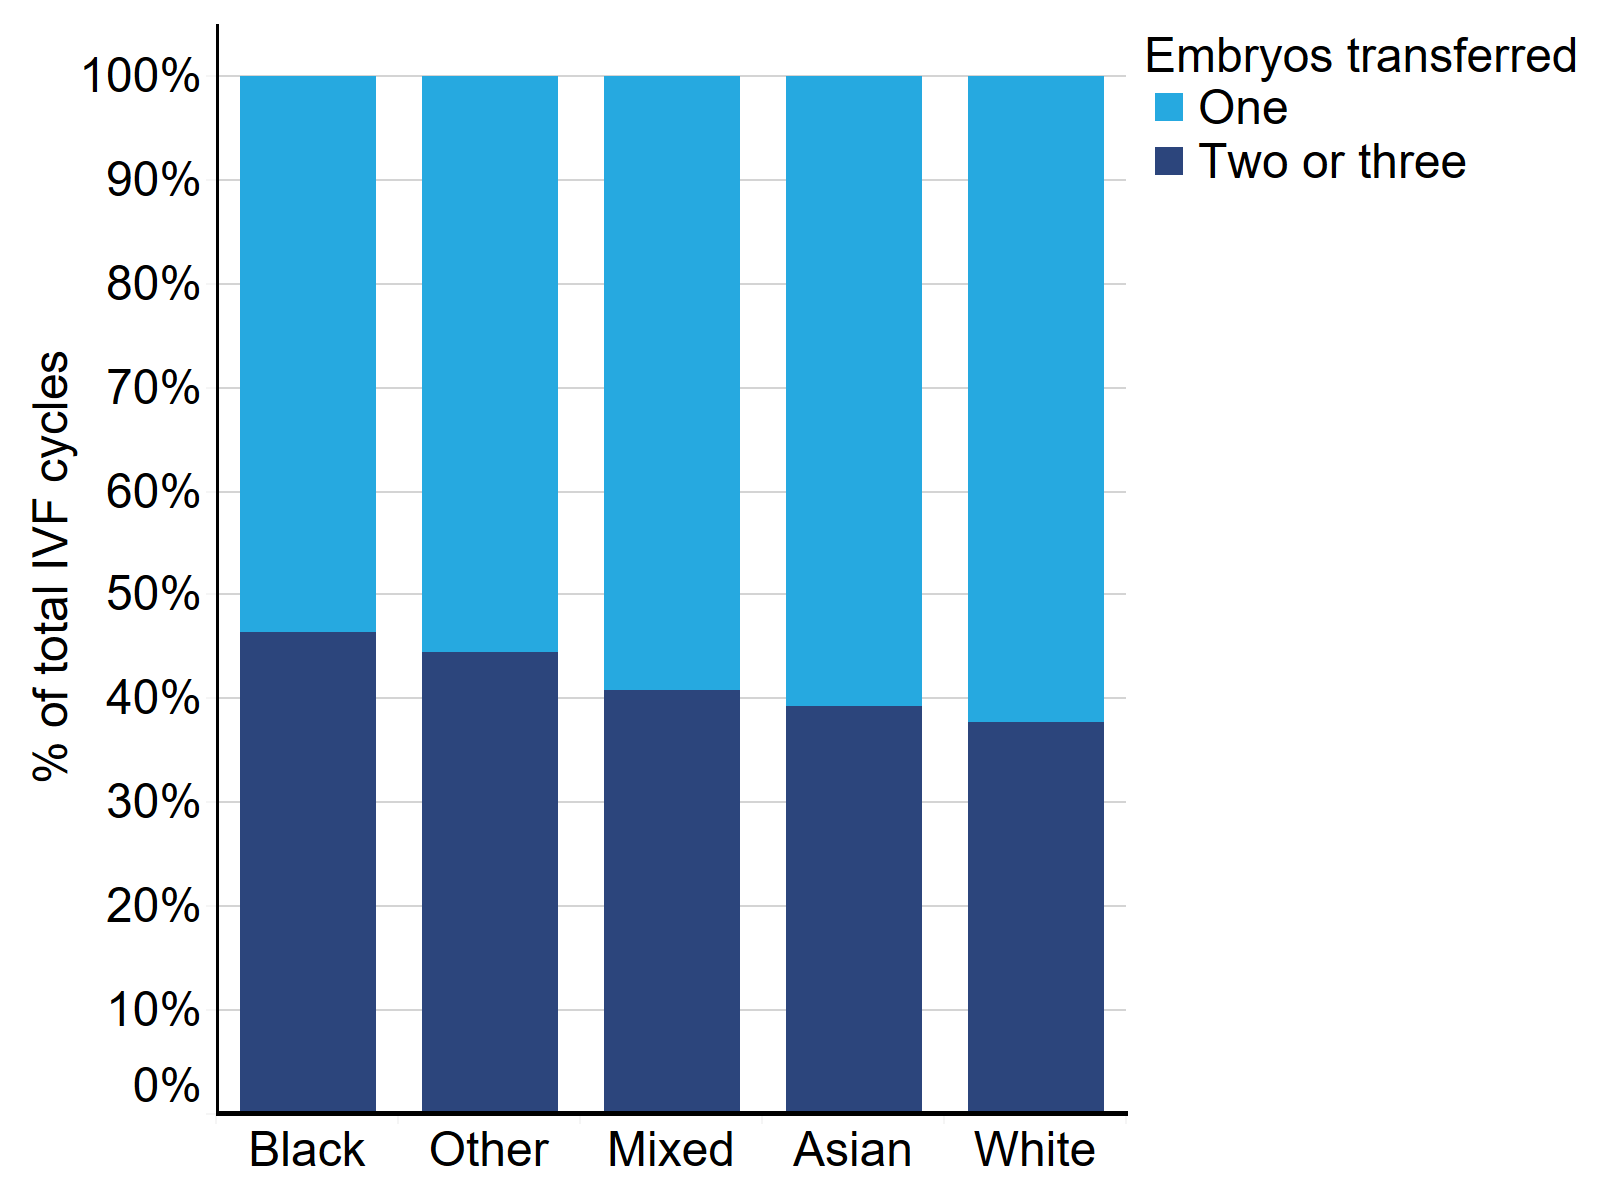
Download the underlying data for Figure 4. (xlxs 12kb)
Note figure 4: This data excludes cycles where a pregnancy was recorded but not the outcome.
3. White egg donors most commonly used across all ethnic groups
Use of donor eggs and sperm has increased in recent years and was used in 12% of all IVF cycles in 201816. From 2014-18, the proportion of all fertility cycles using donor sperm or eggs varied by ethnic group: Asian 8%, Other 10%, Black 17%, Mixed 20%, and White 22%. These differences relate in part to cultural and/or religious beliefs and stigma around donation, particularly in South Asian communities, where the use of donor eggs or sperm can be a particularly sensitive issue17.
In IVF cycles using donor sperm, most donor ethnicities matched that of the partner ethnicity from 2014-2018 (Table 1). In IVF cycles using donor sperm, 96% of cycles with a White partner used a White donor. There were also high rates of donor ethnicity matching with Asian (67%) and Black (65%) partners. In contrast, in cycles where the partner identified as Other or Mixed, White sperm donors were used by 74% and 48% of patients respectively.
In IVF cycles using donor eggs, White egg donors were the most commonly used among the majority of ethnic groups from 2014-2018 (Table 2). White egg donors were used in 98% of cycles with a White patient, 75% for Other patient cycles, 59% of cycles with a Mixed patient and 52% of cycles with an Asian patient. Black patients most commonly used Black egg donors in treatment (55%) followed by Mixed egg donors (27%). The high use of White donors, particularly egg donors, may relate to lack of availability of donors in some ethnic groups (section 4).
Table 1. Sperm donor ethnicity used commonly matches the ethnicity of the partner
| Sperm donor ethnicity | Partner ethnicity | ||||
|---|---|---|---|---|---|
| Asian | Black | Mixed | Other | White | |
| Asian | 67% | <2% | 8% | 7% | 0% |
| Black | 1% | 65% | 12% | 3% | 0% |
| Mixed | 7% | 20% | 25% | 4% | 2% |
| Other | 6% | <2% | 6% | 11% | 1% |
| White | 20% | 13% | 48% | 74% | 96% |
Download the underlying data for Table 1. (xlxs 12kb)
Table 2. White egg donors were the most commonly used across ethnic groups
| Egg donor ethnicity | Patient ethnicity | ||||
|---|---|---|---|---|---|
| Asian | Black | Mixed | Other | White | |
| Asian | 38% | <1% | 9% | 8% | 0% |
| Black | <1% | 55% | 3% | 3% | 0% |
| Mixed | 7% | 27% | 25% | 5% | 1% |
| Other | 3% | 1% | 4% | 10% | 0% |
| White | 52% | 16% | 59% | 75% | 98% |
Download the underlying data for Table 2. (xlxs 12kb)
4. Fewer Asian egg and sperm donors compared to UK Asian population
From 2014-2018, there were about 8,500 egg donors and 3,900 sperm donors in the UK (Table 3). Most egg donors from 2014-2018 were White (89%), followed by Asian (4%), Mixed (3%), Black (3%) and Other (1%) donors. About 86% of sperm donors were White from 2014-2018, and the remaining donors were made up of Asian (5%), Mixed (5%), Other (4%) and Black donors (3%). The proportion of Asian egg and sperm donors was notably lower than both the Asian population estimates (7%) and the proportion of Asian IVF patients (14%), (section 5). The lower proportions of Asian donors may be due to cultural and religious factors relating to donation17.
Table 3. Fewer Asian egg and sperm donors
| Egg donors | Sperm donors | |||
|---|---|---|---|---|
| Count | % of total | Count | % of total | |
| White | 7,506 | 89% | 3,360 | 86% |
| Other | 90 | 1% | 152 | 4% |
| Asian | 375 | 4% | 214 | 5% |
| Mixed | 250 | 3% | 201 | 5% |
| Black | 235 | 3% | 102 | 3% |
Download the underlying data for Table 3. (xlxs 12kb)
Donor eggs and sperm may be imported to the UK to access donors matching specific criteria such as ethnicity. About 44% of all sperm donations were imported in 2014-2018, whereas only 3% of egg donations were imported. Donations from Mixed (76%), Other (64%) and Black (63%) sperm donors were more likely to be imported from 2014-2018 (Figure 5). In contrast, White and Asian sperm donors were most commonly registered in the UK, with only 43% and 32% respectively of sperm donations imported from outside the UK.
Egg donors were mostly registered in the UK from 2014-2018, with egg donations from donors of Other ethnicities most likely to be imported at 10%, followed by Black donors at 5%.
Figure 5. Donor sperm typically imported for Mixed, Other and Black donor ethnicities
Proportion of sperm and egg donors imported to the UK by ethnicity, 2014-2018 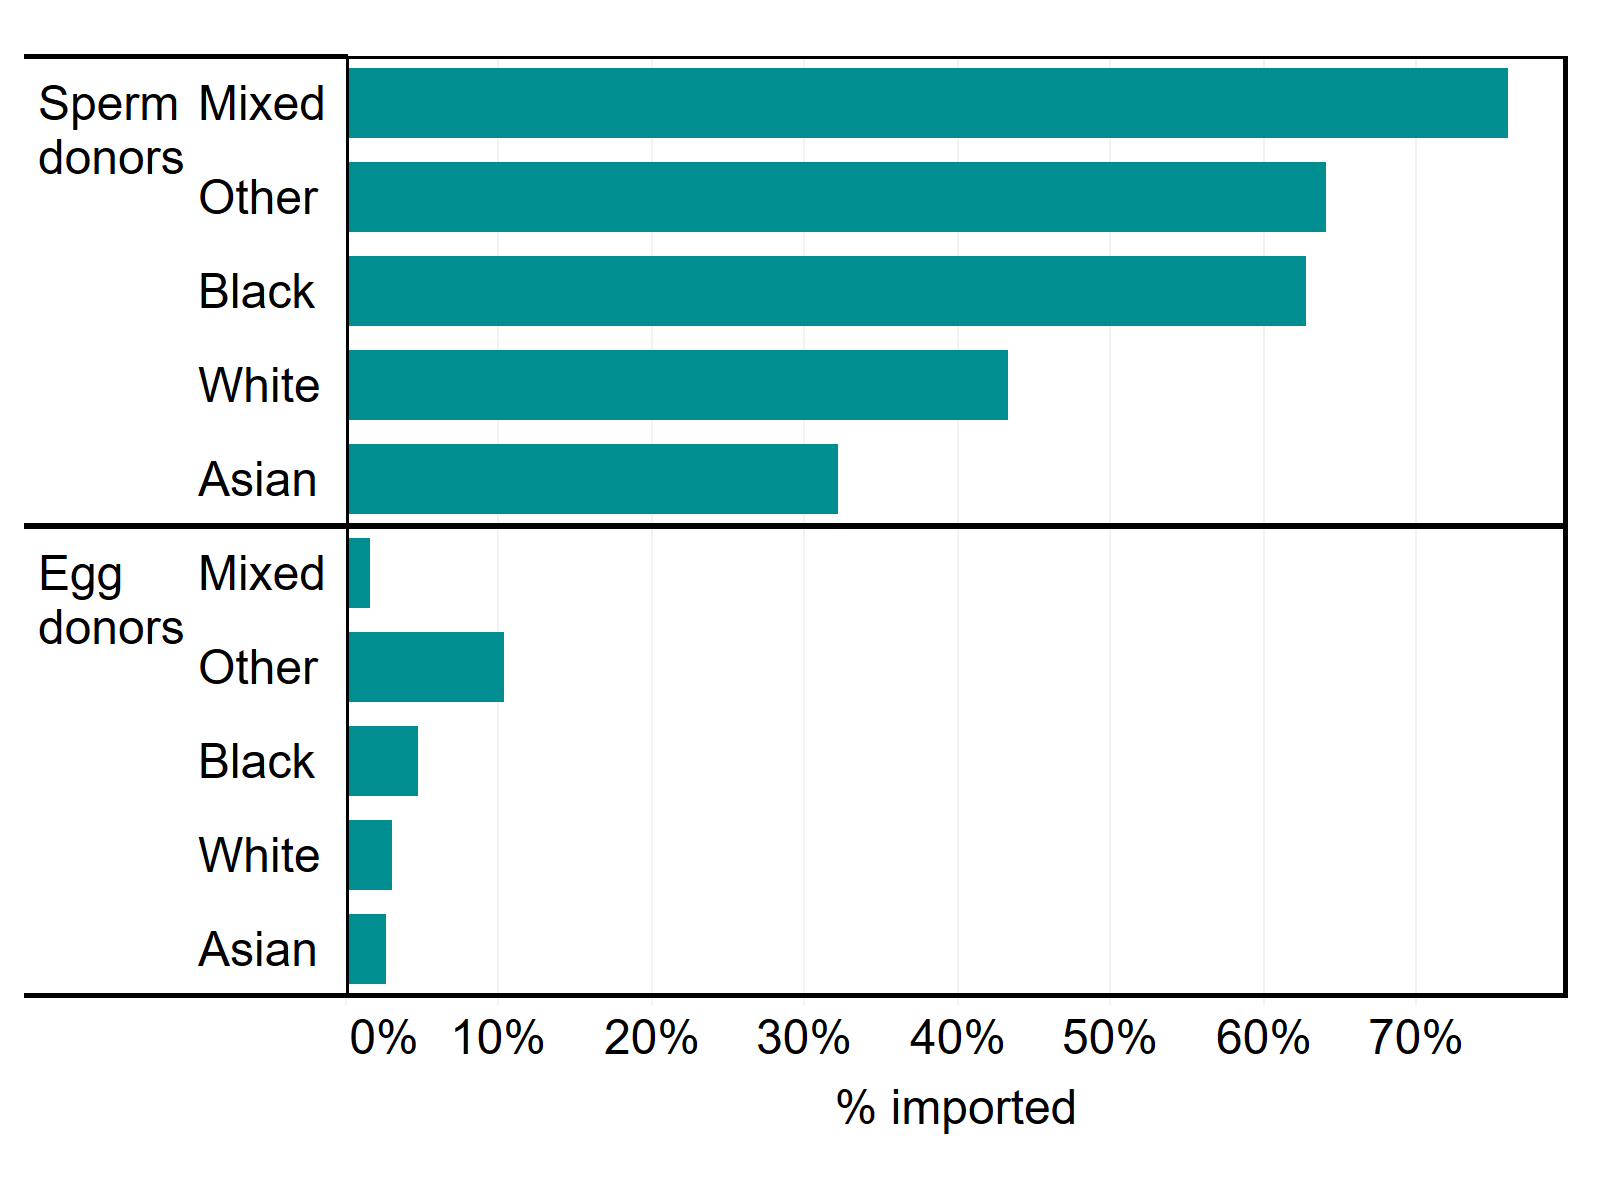
Download the underlying data for Figure 5. (xlxs 12kb)
5. Asian patients represent a larger proportion of IVF users
In 2018, IVF treatment was predominantly used by White patients (78%), followed by Asian (14%), Black (3%), Other (3%) and Mixed (2%) patients. As shown in Table 4 below, more Asian patients used IVF (14%) in 2018 compared to the UK population estimate (7%). In contrast, there were fewer White IVF patients (78%) compared to the UK population (87%).
For DI, the proportions of patients by ethnicity in 2018 were: White (92%), followed by Asian (3%), Black (2%), Mixed (2%) and Other (1%). The variation between the UK population and DI patients was mainly underrepresentation in Asian (3% DI, 7% UK) patients. This may be due in part to fewer Asian patients having treatment with a female partner than other ethnic groups – see section 8. See section 3 and section 4 for information on donor use and availability by ethnicity.
Table 4. Asian patients use DI at lower rates
| Proportion by ethnicity | |||||
|---|---|---|---|---|---|
| White | Asian | Black | Other | Mixed | |
| UK population | 87% | 7% | 3% | 2% | 2% |
| IVF patients | 78% | 14% | 3% | 3% | 2% |
| DI patients | 92% | 3% | 2% | 1% | 2% |
Download the underlying data for Table 4. (xlxs 12kb)
Note table 4: UK population estimate is calculated using 2011 census data for Scotland and Northern Ireland and ONS 2019 estimate data based on the 2011 census for England and Wales18-20. Patient’s acting as surrogates have been excluded from this table.
6. Variation in NHS-funded IVF cycles larger in younger age groups
Across the UK, 37% of IVF cycles were funded on average by the NHS in 2018, with considerable regional variation in funding16. NHS funding decreases with age and larger variation exists in younger ages. For example, among patients aged 20-34, NHS-funding was highest among Asian patients (58%), followed by White (55%), Black (52%), Other (51%) and Mixed (49%) from 2014-2018.
These differences likely relate to regional funding availability and eligibility criteria set by the devolved governments and Clinical Commissioning Groups in England. Availability of IVF funding can range from no funding to three funded cycles depending on location and eligibility restrictions applied22.
Figure 6. NHS-funded cycle vary by ethnicity in younger age groups
Proportion of IVF cycles funded by NHS, patient age and ethnicity, UK, 2014-2018 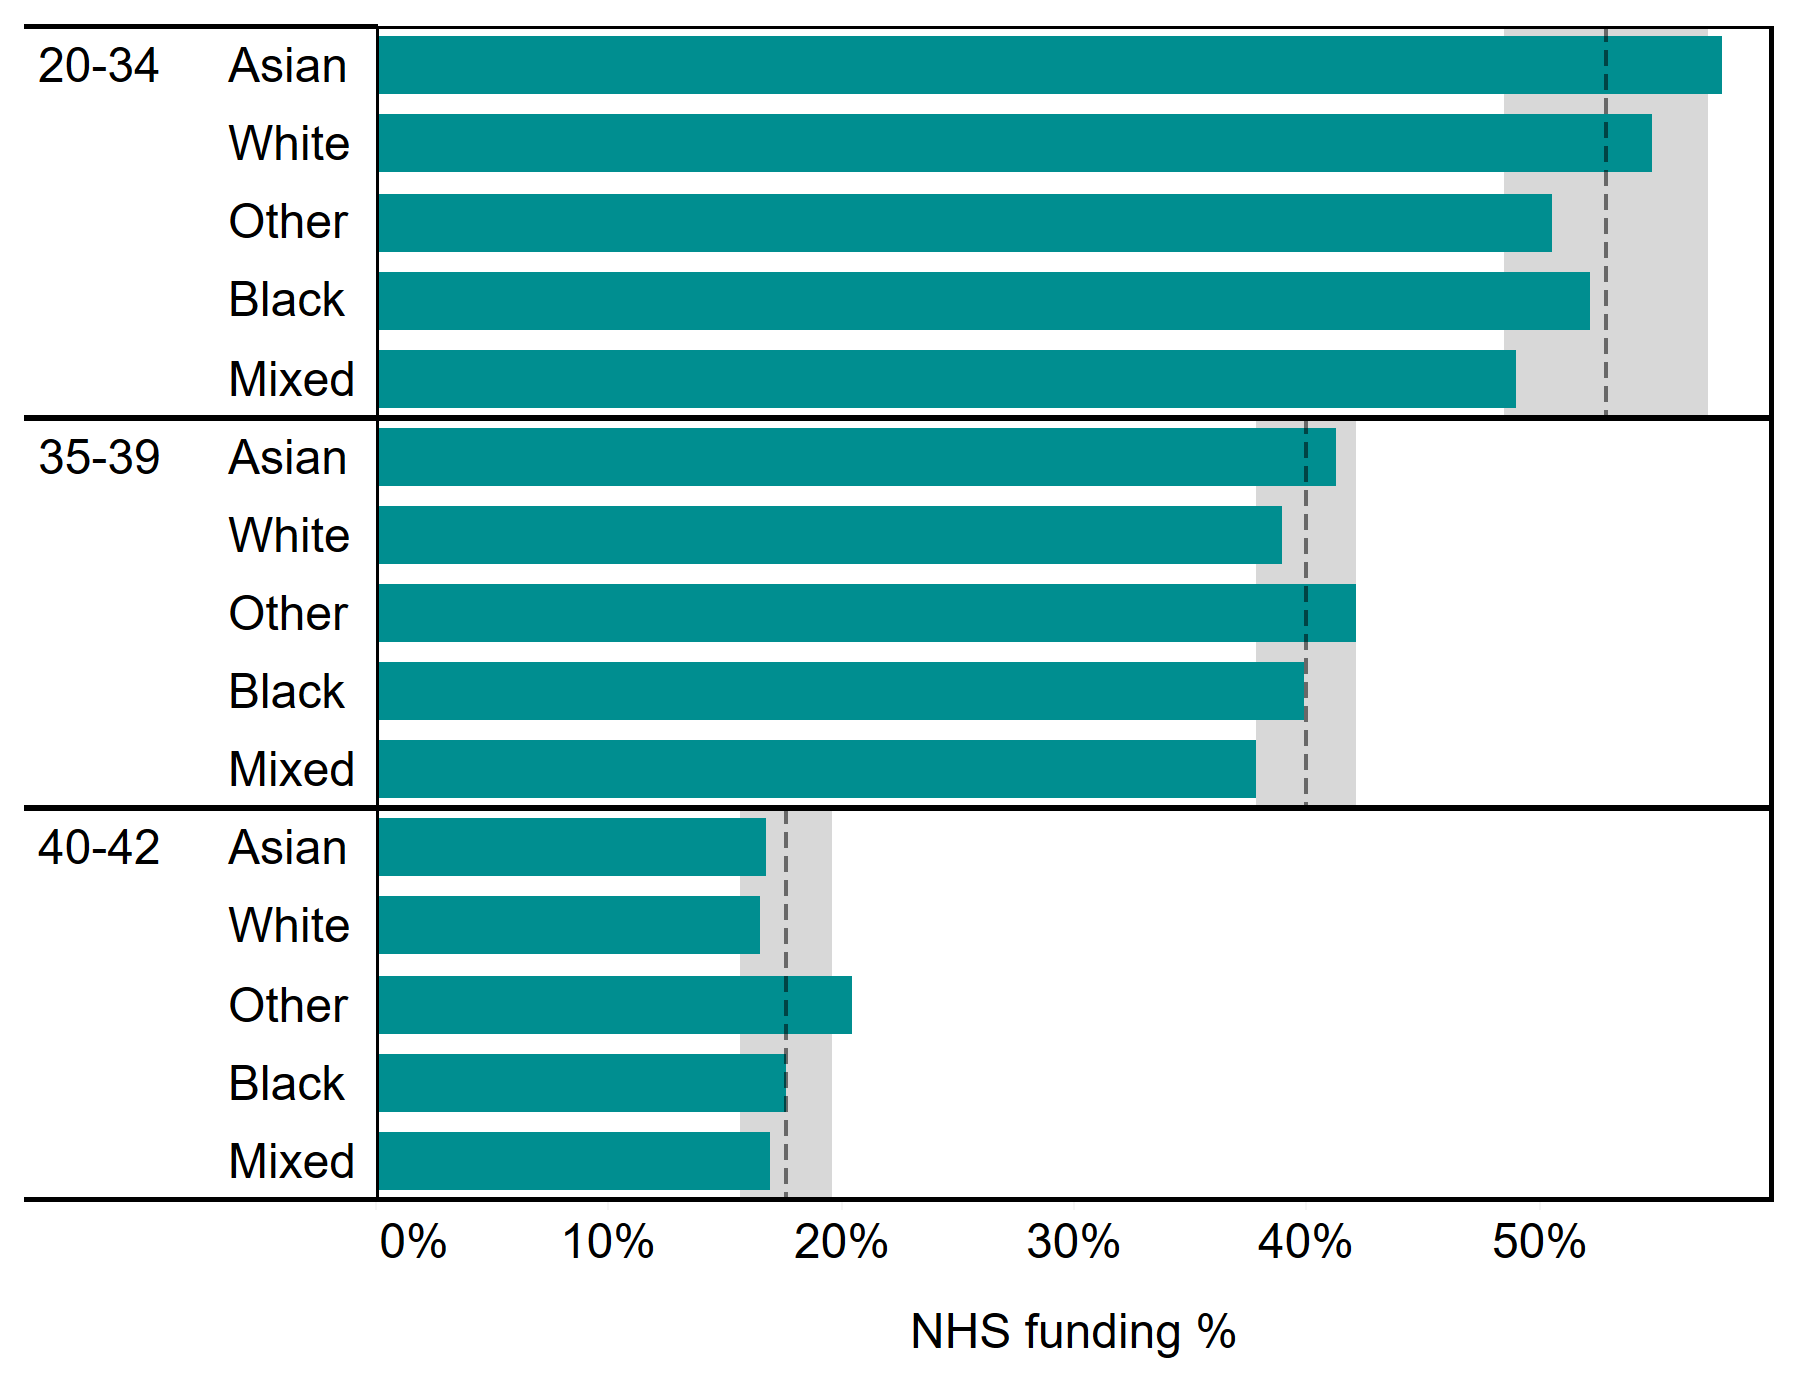
Download the underlying data for Figure 6. (xlxs 12kb)
Note figure 6: Ages above 42 have been excluded in this figure due to reduced patient numbers which make it difficult to draw comparisons. Age groupings used in figure are based on funding criteria set by Clinical Commissioning Groups and devolved governments. Grey shading represents 95% confidence interval and dashed line represents average within each patient age group.
7. Black patients start IVF later than other ethnic groups
The average age at which patients started IVF treatment in 2018 was 34.6, but this varied by ethnicity. Patients of Mixed, Other and White ethnic groups have commonly started IVF around 34-35 years of age and this has remained fairly consistent from 2009-2018 (Figure 7).
From 2009-2018, Asian patients remained the youngest ethnic group at the start of IVF treatment, though this has steadily increased from below 33 years of age in 2009 to just above 34 years of age in 2018. Within the Asian ethnicity, Chinese patients tended to be older at around 36 years of age in 2018, while South Asian patients were younger at an average age below 34.
The average age of patients at their first IVF cycle has increased in recent years for Black patients from 35.1 in 2015 to above 36.4 in 2018. Research has suggested treatment costs as a major factor in treatment delays7, which may indicate cost-related changes since 2015 in areas with higher proportions of Black residents, such as changes to NHS funding.
Figure 7. The average age of a Black patient starting IVF has increased in recent years
Average patient age at first IVF treatment by ethnic group, 2009-2018 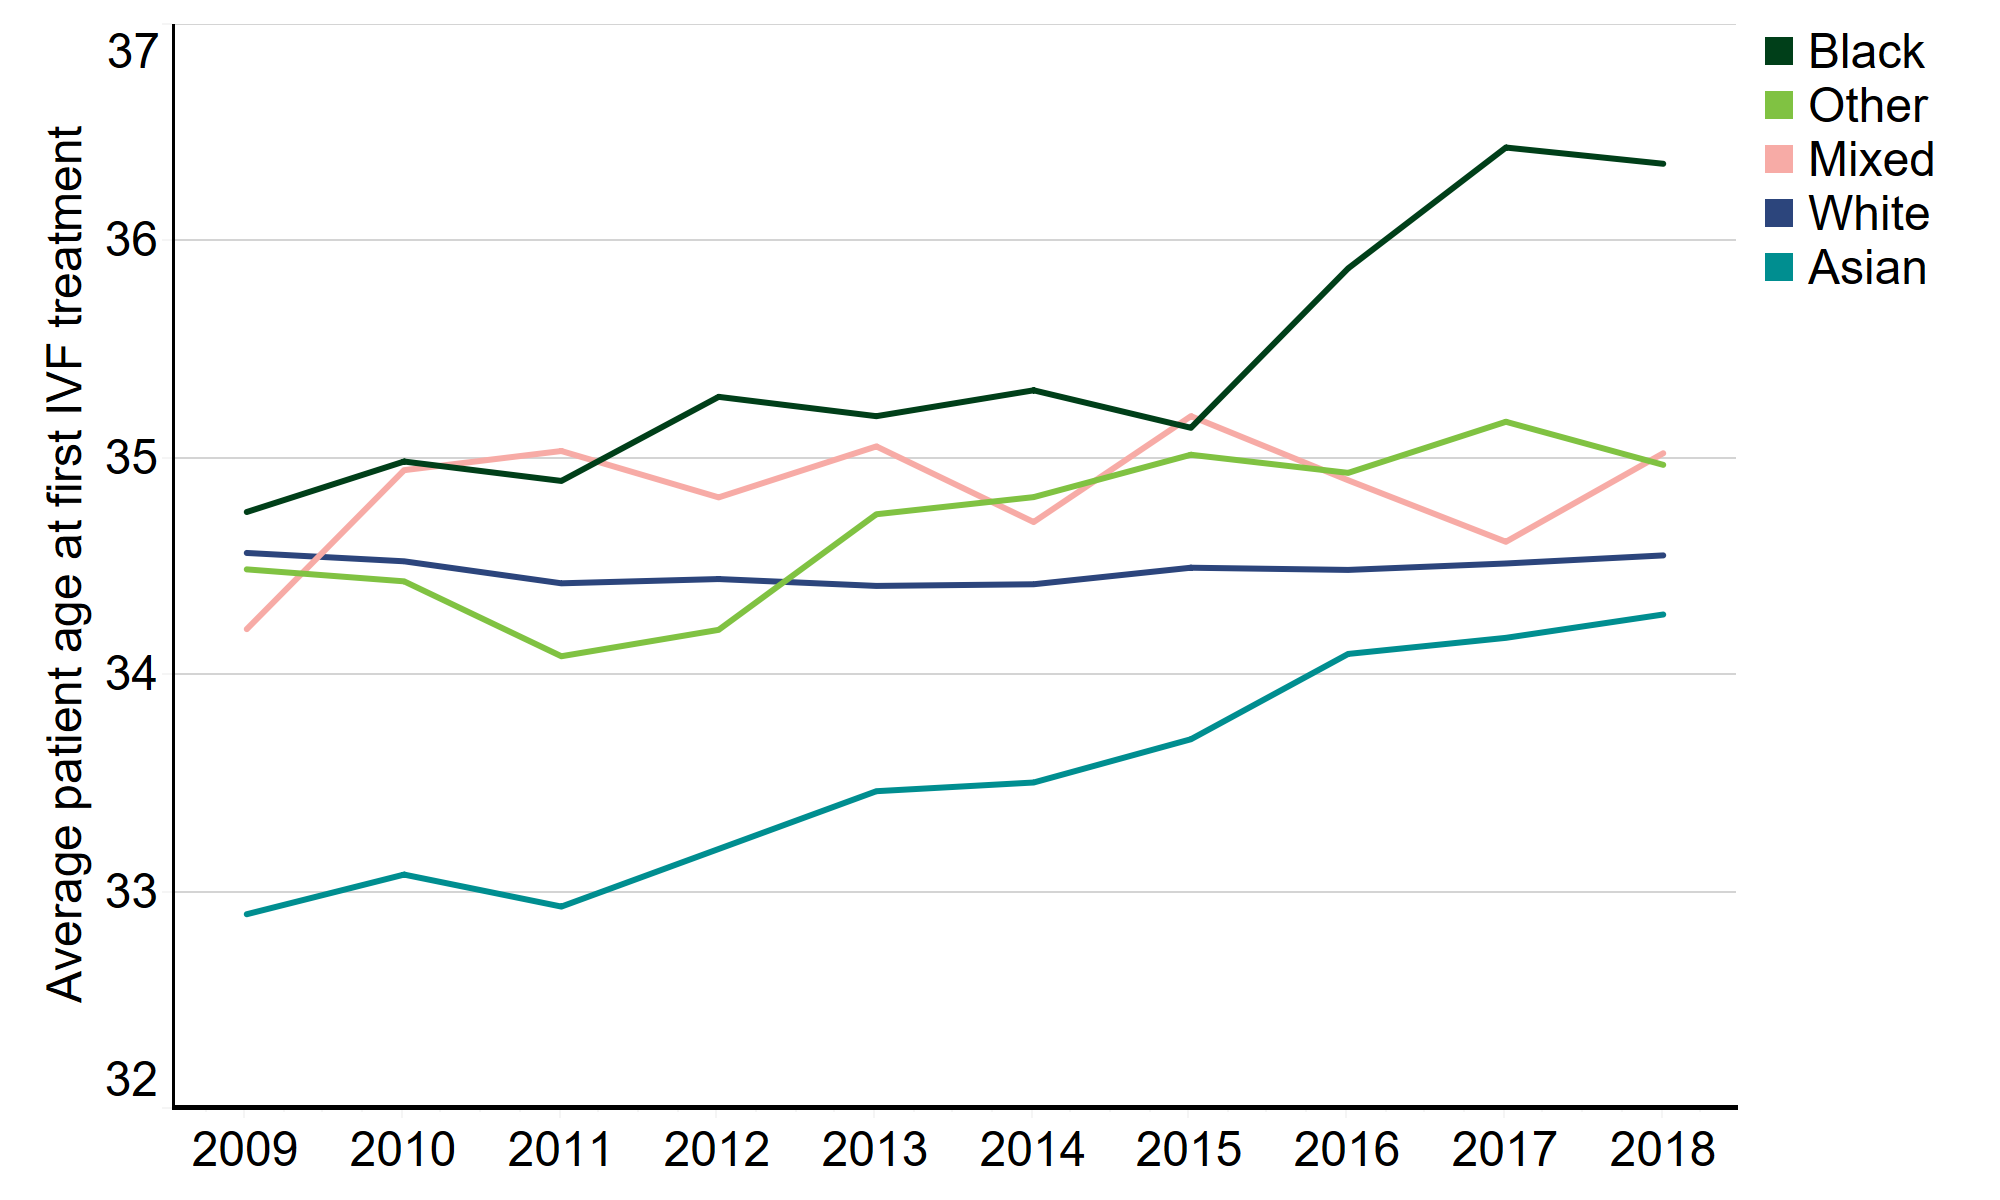
Download the underlying data for Figure 7. (xlxs 12kb)
8. Female same-sex relationships more common among patients of White and Mixed ethnicities
On average from 2014-2018, IVF treatments were most used by patients with a male partner (95%), while DI treatments were more commonly used by patients in female same-sex relationships (41%). As seen in Table 5, partner types vary by ethnic group.
Asian patients more commonly had a male partner for both IVF and DI treatment than other ethnic groups (99% of IVF treatments, 67% of DI treatments), followed closely by patients of Other ethnicities (99% IVF, 63% DI).
White patients had the highest proportion of patients with female partners (3% IVF, 44% DI), followed by patients of Mixed ethnic groups (2% IVF, 34% DI). Lastly, Black patients had higher proportions of single patients compared to other ethnic groups (3% IVF, 38% DI), and similarly for Mixed ethnicity patients (3% IVF, 28% DI).
Table 5. Female same-sex relationships were more common among patients of White or Mixed ethnicities than other ethnic groups
| Percent of total by ethnic group | ||||||
|---|---|---|---|---|---|---|
| Patient count | Male partner | Female partner | No partner | |||
| IVF | White | 119,127 | 95% | 3% | 2% | |
| Asian | 21,110 | 99% | 0% | 1% | ||
| Other | 5,133 | 99% | 1% | 1% | ||
| Black | 5,038 | 97% | 1% | 3% | ||
| Mixed | 2,660 | 95% | 2% | 3% | ||
| DI | White | 8,939 | 38% | 44% | 19% | |
| Asian | 348 | 67% | 13% | 21% | ||
| Other | 124 | 63% | 18% | 19% | ||
| Black | 211 | 45% | 18% | 38% | ||
| Mixed | 179 | 39% | 34% | 28% | ||
Download the underlying data for Table 5. (xlxs 12kb)
Conclusions and next steps
There has been much public discussion in recent years of health inequalities between ethnic communities across the UK. Those inequalities have been highlighted by the COVID-19 pandemic. This report notes several disparities across ethnic groups in fertility treatment. While we do not have definitive explanations for why these differences exist, we are committed to using the data we collect and feedback from our licensed clinics and patients, to understand any inequalities in access and outcomes in fertility treatment in the UK, and take action where needed. Although this report does not look directly at discrimination, there is evidence that this is widespread in other aspects of UK life, including within the health sector, and we will act in this context.
In the short term, we will do the following:
Actions for the HFEA
- We will speak to patients and fertility clinics to determine where differences in patient experience may exist and use this information to identify where we, as a regulator, can promote greater equity across the fertility sector.
- We will review the feedback from clinics and patients against our Code of Practice to see if we should make any changes, for example, relating to information provision.
- We will consider whether we should provide further specific information on our website for Black and Ethnic minority patients, for example, in relation to particular medical issues or donor availability.
- To better enable research on the disparities across ethnic groups within the fertility sector, we will include more information on ethnicity in our regular data releases. We will add tables to our annual statistical release, Fertility Trends, to provide up-to-date information on fertility outcomes by patient ethnicity. The upcoming release of our publicly available anonymised dataset for 2017-2018 in Spring 2021 will also include variables that enable research on variation in treatment and outcomes by ethnicity.
- The issue of accessing donors of certain minority ethnic backgrounds has been identified here, and in other publications. While we are not involved in donor recruitment, we must be conscious of the difficulties some patients face in finding a donor with a shared ethnic background and raise awareness of this where we can. We will continue to monitor and publish figures on donor use to draw attention to any lack of donors from a particular group.
- We will work with grassroots and other organisations to further understand cultural and religious beliefs that may impact on donor recruitment and help to overcome any barriers that may exist.
- We have committed to engaging with GPs in our 2020-2024 strategy and will ensure we share the data we have with them, highlighting for example that in some communities, access to fertility treatment is starting at a later age.
- The Royal College of Obstetricians and Gynaecologists (RCOG) recently established a Race Equality Taskforce and one of its key priorities is to look at inequalities in women’s health outcomes, including areas of women’s health where ethnic disparities may exist. We will present the findings of this report to the RCOG Race Equality Taskforce and we look forward to their feedback and any further recommendations of actions we or others could take.
Actions for clinics
- We urge clinics to review their own information provision in relation to the statistics in this report to ensure all patients are informed of their own likely chance of success based on all factors, including ethnicity.
- We publish donor waiting times by ethnicity on our Choose a Fertility Clinic webpage and we encourage all clinics to regularly update this information – especially if the wait is longer for different ethnicities – to help patients who require donated sperm and eggs to plan their treatment.
- Clinics should be mindful of the higher multiple birth rate in certain ethnic groups and seriously consider a review of their multiple birth minimisation strategies where necessary.
- Clinics are also asked to ensure ethnicity information is collected from patients. Currently 12% of patients have no ethnicity data recorded on our Register.
Actions for others
- We encourage all those who commission fertility services to review their funding eligibility criteria to consider whether these have an adverse impact on access to treatment among particular ethnic groups.
- This report is limited by the data we hold on our Register and more research is needed to understand the many external factors that contribute to these disparities to inform evidence-based decision-making.
- More in-depth data is available to researchers upon application through the HFEA Register Research Panel and we encourage researchers to get into contact with us at register.research@hfea.gov.uk if interested.
About our data
The information that we publish is a snapshot of data provided to us by licensed clinics. The figures supplied in this report are from our data warehouse containing Register data as at 07/01/2020. We have excluded approximately 850 cycles due to technical issues at one centre that resulted in reporting errors. Results are published according to the year in which the cycle was started. Due to rounding, some percentages may not add to 100%.
Ethnic comparisons are limited by the data we hold on our Register. There are a number of external factors that contribute to the differences we outline in this report, which are not collected on the Register such as socioeconomic status, BMI and smoking status.
The way in which ethnicity is recorded on registration forms has changed over time and has been grouped into the five broad ethnicity categories as recorded by the ONS. In 2018, ethnicity was not recorded in the data submitted to the HFEA for about 6,000 IVF cycles and 200 DI cycles accounting for about 12% of recorded patients overall. Patients with no recorded ethnicity have been excluded throughout this report to simplify comparisons across ethnic groups. See the underlying dataset for further information on cases of no recorded ethnicity.
Assisted reproductive technologies are a rapidly evolving field and practices such as number of embryos transferred and NHS funding have changed over this time – these changes are documented in Fertility Trends. For this report, where numbers by ethnicity are small in a single year, we have compiled up to five years of data to provide more robust estimates for comparison.
For further information, please see our quality and methodology report and information page in the underlying dataset.
Contact us regarding this publication
Media: press.office@hfea.gov.uk
Statistical: intelligenceteam@hfea.gov.uk
Accessibility: comms@hfea.gov.uk
Notes on Ethnic diversity in fertility treatment 2018
- Fertility treatment: trends and figures 2018
- Ethnic groups from Race Disparity Unit, Cabinet Office UK
- Effect of ethnicity on live birth rates after in vitro fertilization/intracytoplasmic sperm injection treatment: analysis of UK national database, BJOG, 2017, 124: 904-910
- Disparity in assisted reproductive technologies outcomes in black women compared with white women, Fertility and Sterility, 2008, 90: 1701-1710
- Adverse effects of female obesity and interaction with race on reproductive potential, Fertility and Sterility, 2017, 107: 868-877
- Racial and ethnic disparities in assisted reproductive technology access and outcomes, Fertility and Sterility, Fertility and Sterility, 2016, 105: 1119-1123
- Ethnicity and assisted reproductive technologies, Clinical Practice, 2012, 9: 651-658
- Pregnancy changes on an IVF/ICSI waiting list: a national prospective cohort study, Human Reproduction, 2008, 23: 1627-1632
- Asian ethnicity is associated with reduced pregnancy outcomes after assisted reproductive technology, Fertility and Sterility, 2007, 87: 297-302
- IVF Risk by National Health Service
- Perinatal outcomes in twin pregnancies complicated by maternal morbidity: evidence from the WHO Multicountry Survey on Maternal and Newborn Health, BMC, 2018, 18: 449
- What Are the Fetal Growth Patterns of Singletons, Twins, and Triplets in the United States? Clinical Obstetrics and Gynecology, 1998, 41: 115-125.
- Lessons learned to inform maternity care from the UK and Ireland Confidential Enquiries into Maternal Death and Morbidity 2015-2017 by Mothers and Babies: reducing Risk through Audits and Confidential Enquiries across the UK
- African and African Caribbean background risk factor information from the British Hearth Foundation
- Disparities in access to effective treatment for infertility in the United States: an Ethics Committee opinion, Fertility and Sterility, 2015, 104: 1104-1110
- See Fertility treatment: trends and figures 2018 underlying dataset
- Assisted Conception and South Asian communities in the UK: public perceptions of the use of donor gametes in infertility treatment, Human Fertility, 2013, 16: 48–53
- Northern Ireland Census 2011 Key Statistics Summary Report by Northern Ireland Statistics and Research Agency
- Scotland Census 2011
- Population characteristics research tables 2019 by the Office for National Statistics
- NHS Funding page by Fertility Network UK
| Publication date: |
|---|