
Fertility treatment 2018: trends and figures
UK statistics for IVF and DI treatment, storage, and donation
Published: 30 June 2020
Fertility trends is our annual statistical release. The key findings are published on this page with a statistical appendix available for download.
Download the underlying data set in .xlsx (151kb).
Download a PDF version of this report (1.04mb).
Table of contents
- Main points
- Section 1. IVF birth rates have increased for patients under 43 years
- Section 2. Birth rates were above 20% per embryo transferred on average in the first three cycles
- Section 3. Using donor eggs can result in high birth rates for older patients, but they are not widely used
- Section 4. The multiple birth rate decreased further to 8% in 2018
- Section 5. Transferring more than one embryo could result in a multiple birth rate over 30%
- Section 6. Embryo and egg storage have increased as freezing becomes more common
- Section 7. NHS-funded cycles decreased in many English regions
- Section 8. Fewer patients had their first IVF cycle funded by the NHS
- About our data
Main points
- About 54,000 patients had 68,724 fresh and frozen in-vitro fertilisation (IVF) cycles and 5,651 donor insemination (DI) cycles at HFEA licensed fertility clinics in the UK in 2018.
- In 2018, the average birth rate per embryo transferred for all IVF patients was 23% and rates have steadily increased over time for all patients aged under 43.
- In 2018, birth rates for patients below 35 were 31% per embryo transferred, compared to below 5% for patients 43 and above when using their own eggs.
- The live birth rate per embryo transferred remains above 20% for each of the first three cycles of IVF treatment.
- Donor eggs can considerably increase the chance of a live birth to above 25%, but only 18% of patients aged 40 and older used donor eggs in 2018.
- The multiple birth rate decreased to 8% in 2018 for the first time.
- Implanting more than one embryo has no significant impact on the chance of a live birth but results in a 32% multiple birth rate for patients under 35.
- Since 2013, the number of egg and embryo storage cycles increased fivefold to just under 9,000 cycles in 2018 as freezing techniques improved and have become more commonplace.
- The level of NHS funding for fertility treatment varies across the UK with 60% of cycles funded by the NHS in Scotland and falling to less than 30% in some parts of England.
1. IVF birth rates have increased for patients under 43 years
About 54,000 patients had 68,724 fresh and frozen in-vitro fertilisation (IVF) cycles and 5,651 donor insemination (DI) cycles at HFEA licensed fertility clinics in the UK in 2018. After years of rapid growth in the number of treatment cycles, these have begun to stabilise.
Birth rates from IVF have steadily increased over time with the average birth rate per embryo transferred at 23% in 2018. Patients under 35 had the highest birth rate per embryo transferred at 31% in 2018, compared to only 9% when the HFEA was established in 1991.
The average age of an IVF patient was 35.3 years in 2018; age is a key factor to consider when looking at birth rates, as fertility decreases with age. In 2018, birth rates per embryo transferred were 25% for patients aged 35-37, 19% for patients aged 38-39, and 11% for patients aged 40-42.
Clinical improvements have led to increased chances of a live birth for all patients below 43 years old. In 2018, patients aged 40-42 had a higher chance of a live birth (11% per embryo transferred) than patients aged under 35 in 1991 (9% per embryo transferred). Patients aged 43 and above have consistently had birth rates below 5% per embryo transferred when using their own eggs. In section 3 we discuss how donor eggs can increase chances of success for older patients to above 20% on average.
Figure 1. Birth rates have increased for all patients below 43 years of age since 1991
Birth rates per embryo transferred using patient eggs by age band, 1991-2018
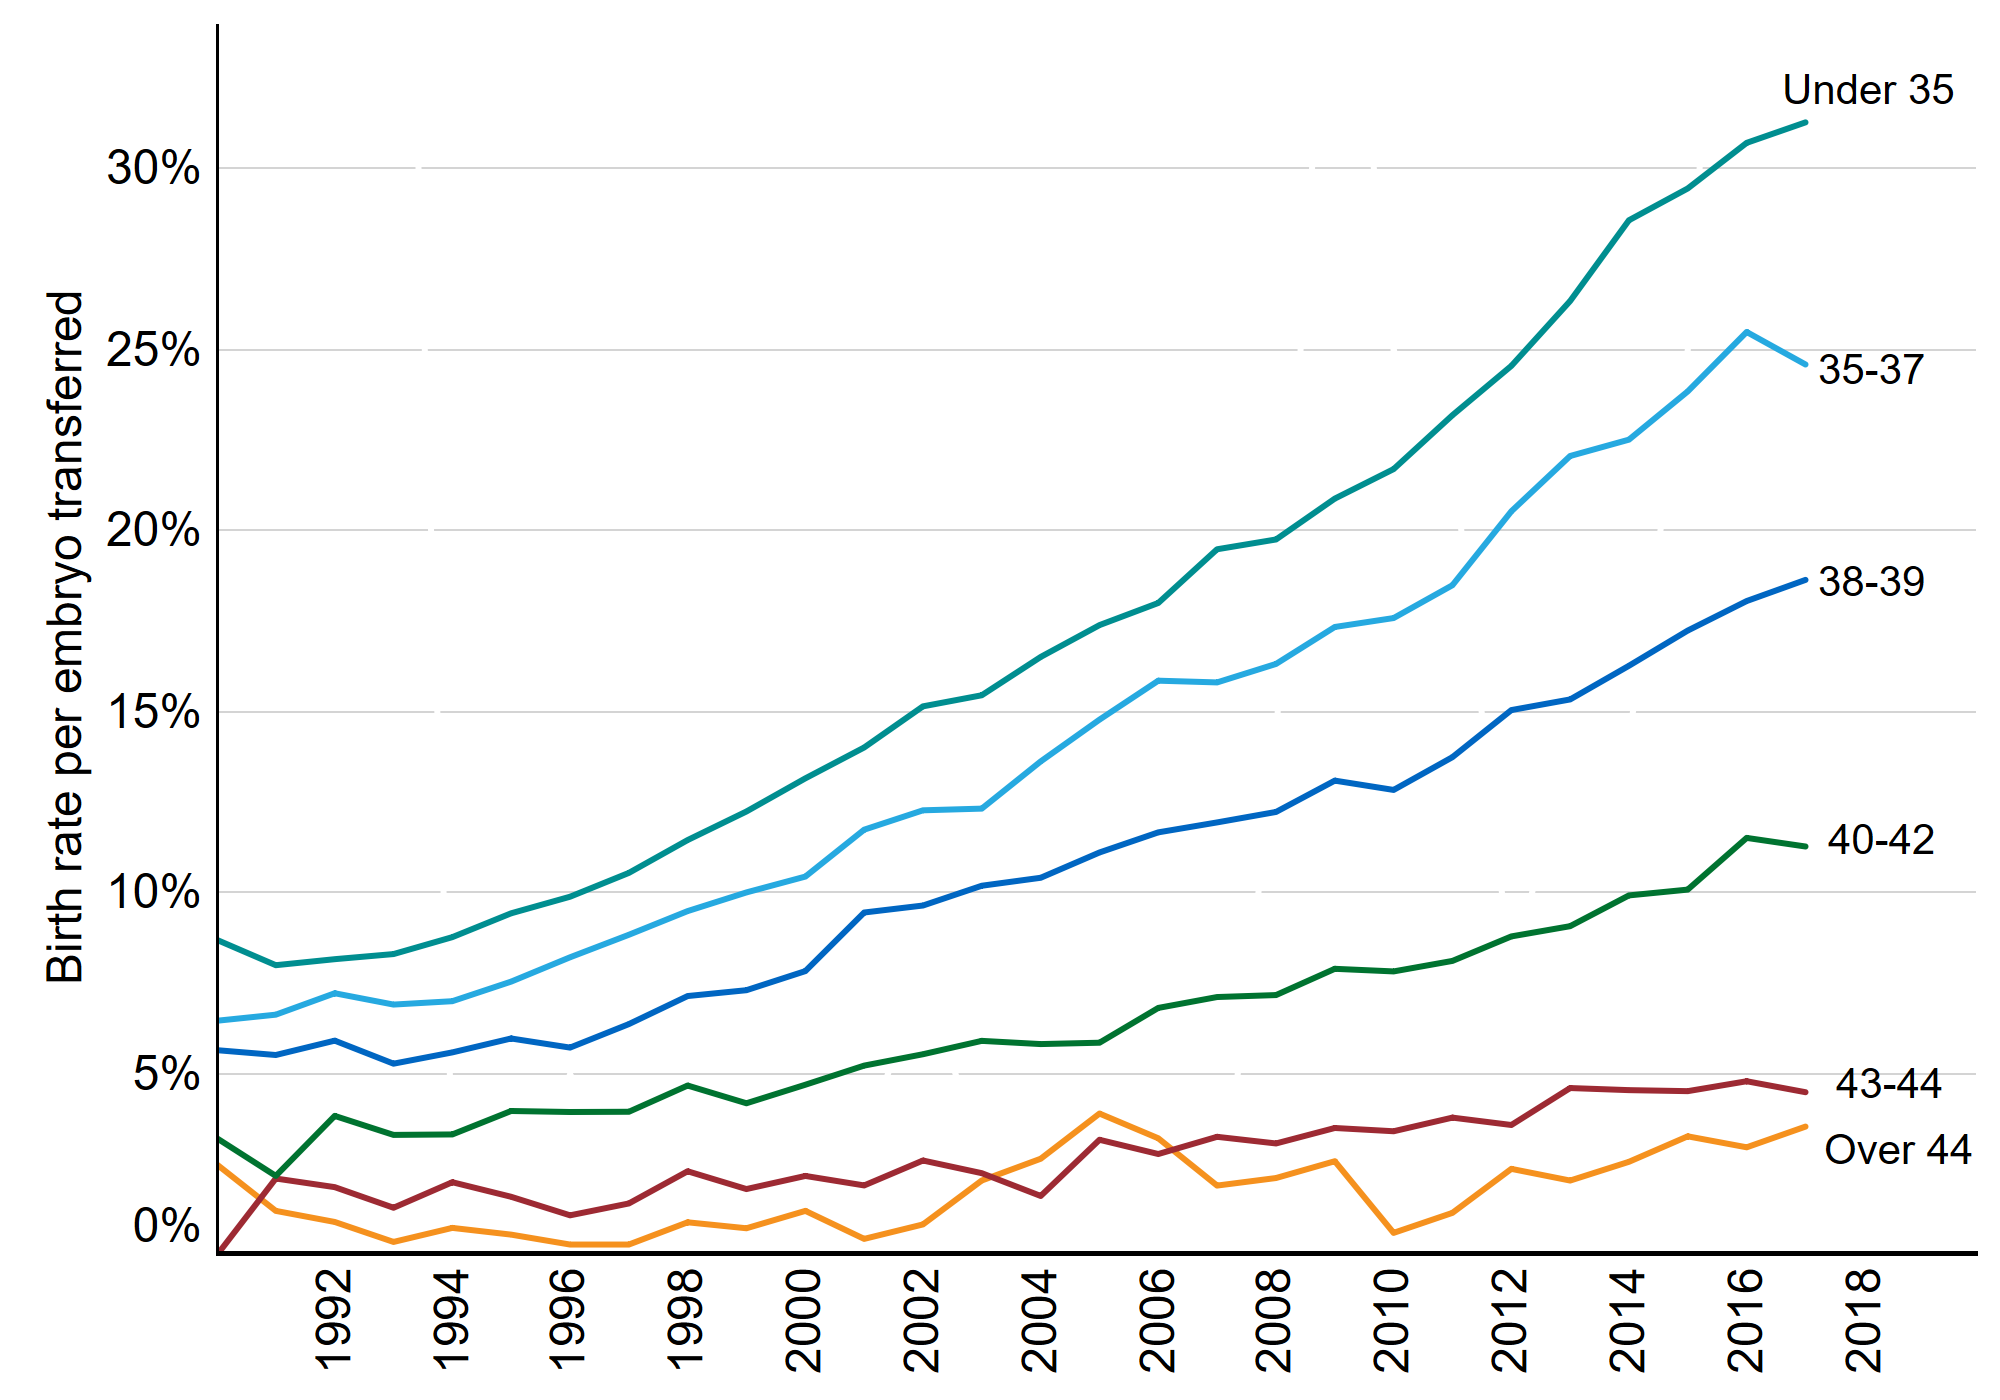
Figure 1 Note: This data includes treatment now only, IVF, Patient egg. It excludes fresh and frozen PGD and PGS, surrogacy, and cycles where pregnancy was recorded but not outcome.
Download the underlying data for Figure 1 as .xlsx (163KB).
If you require the data for Figure 1 in an alternative accessible format, please email comms@hfea.gov.uk.
2. Birth rates were above 20% per embryo transferred on average in the first three cycles
On average, about one in every four embryos transferred resulted in a live birth in 2018. As a result, many patients will have more than one round of embryo transfer; the average patient has three rounds.
The figure below shows the chances of a live birth by cycle number in 2018. The average age of a patient on their first cycle was 34.4 (green line) and their chance of having a live birth on that cycle was 26% per embryo transferred (blue column). By contrast, the average age of a patient on their 10th cycle was 38.9 and their chance of having a live birth on that cycle was 12% per embryo transferred.
The birth rate remains above 20% per embryo transferred for each of the first three cycles and steadily decreases with each new cycle. The reason the average birth rate is lower in later cycles is related to the average patient age, as older patients have lower birth rates and therefore require more cycles (see section 1).
Figure 2. Birth rates per embryo transferred were above 20% on average in first three IVF cycles
Birth rates per embryo transferred using patient eggs by cycle number and patient age, 2018
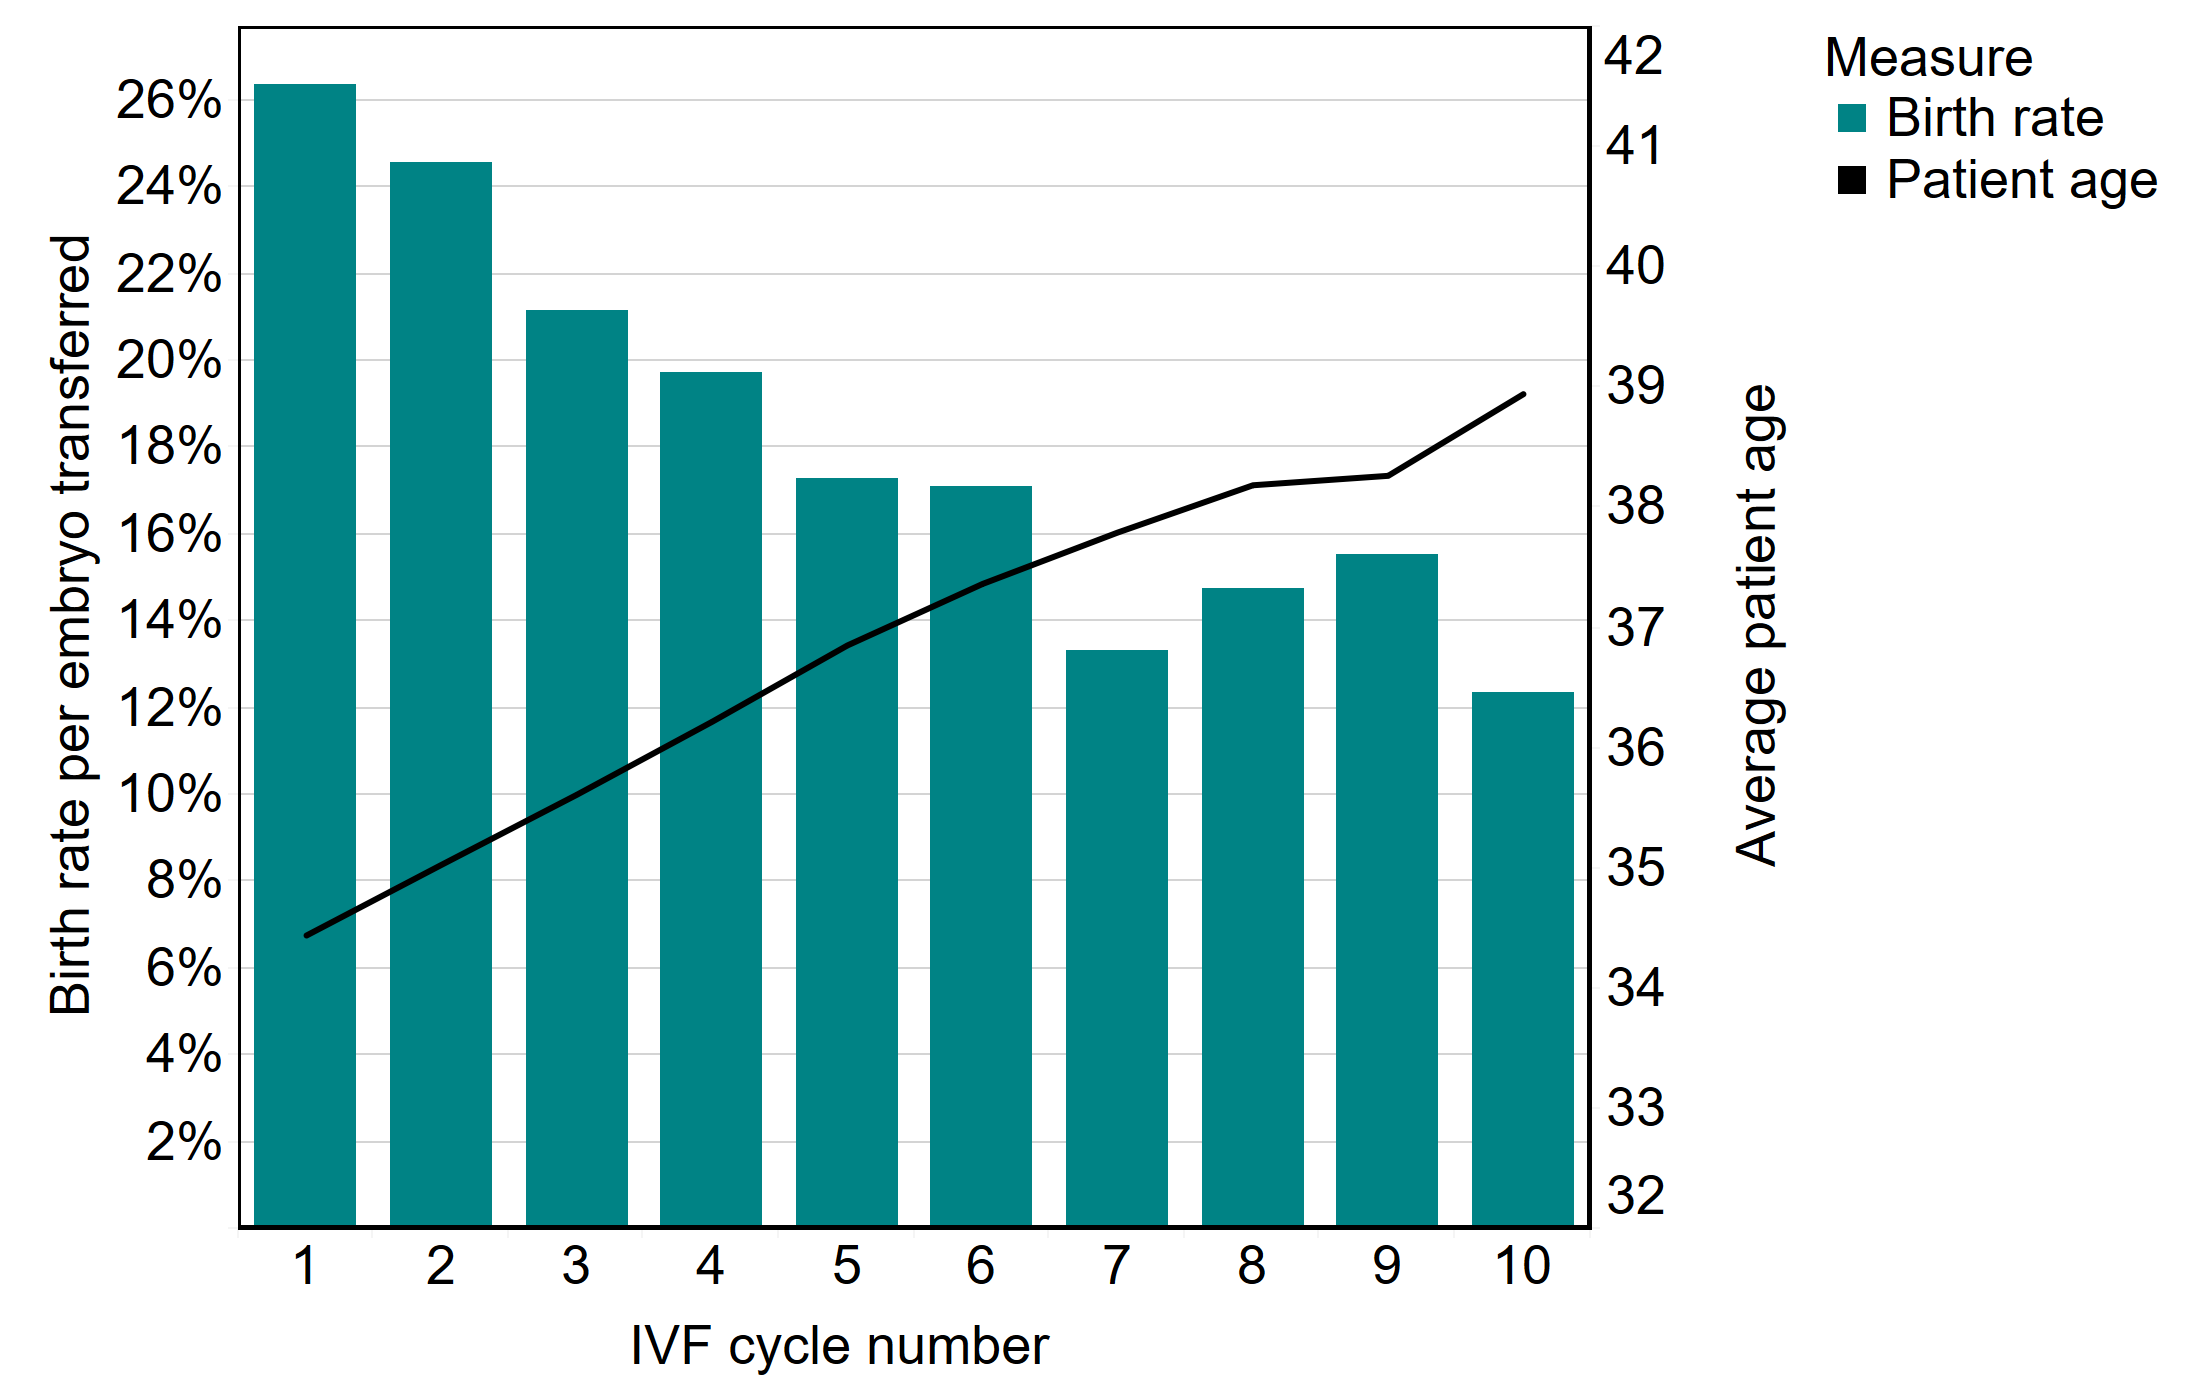
Figure 2 Note: This data includes treatment now only, IVF, Patient egg. It excludes fresh and frozen PGD and PGS, surrogacy, and cycles where pregnancy was recorded but not outcome.
Download the underlying data for Figure 2 as .xlsx (154KB)
If you require the data for Figure 2 in an alternative accessible format, please email comms@hfea.gov.uk.
3. Using donor eggs can result in high birth rates for older patients, but they are not widely used
Birth rates decrease with age where patients use their own eggs in treatment. In 2018, birth rates for patients below 35 were 31% per embryo transferred, compared to below 5% for patients 43 and above.
However, birth rates remained higher (above 25%) for all ages when donor eggs were used as egg donors are five years younger on average (30.2) than IVF patients (35.6).
Figure 3. Birth rates remain above 25% for all ages where donor eggs are used
Birth rates per embryo transferred by age bands and egg source, 2018
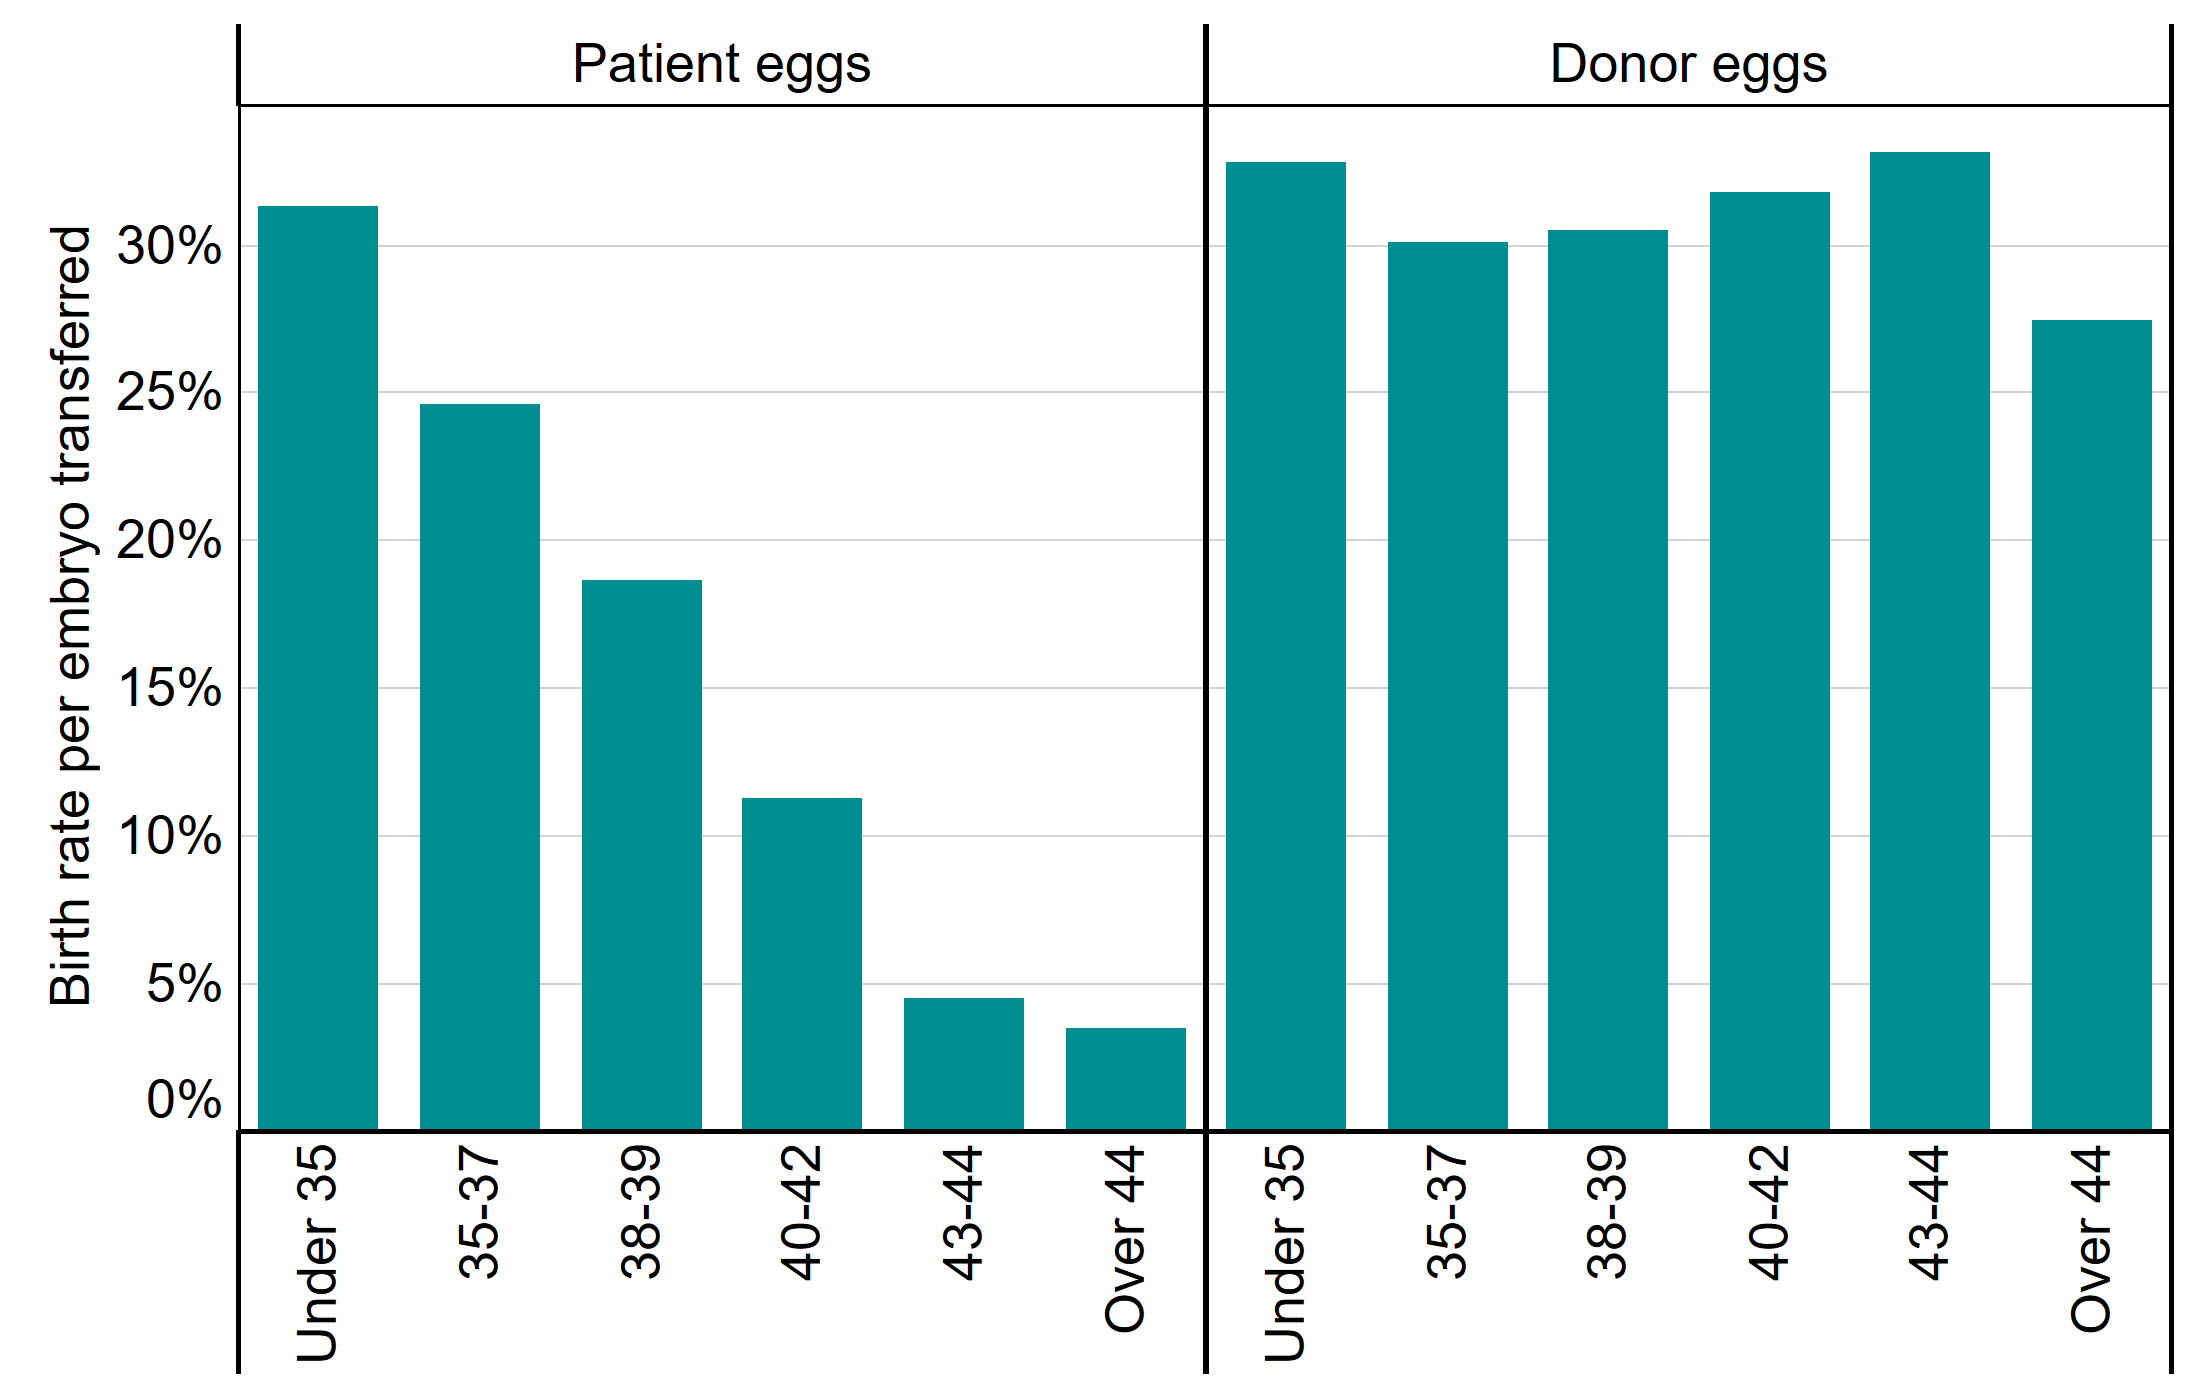
Figure 3 Note: This data includes treatment now only, IVF, Patient egg. It excludes fresh and frozen PGD and PGS, surrogacy, and cycles where pregnancy was recorded but not outcome.
Download the underlying data for Figure 3 as .xlsx (152KB)
If you require the data for Figure 3 in an alternative accessible format, please email comms@hfea.gov.uk.
Although it is clear from the figure above that donor eggs can considerably increase the chance of a live birth for patients 40 years of age and older, only 18% of patients in this age group used donor eggs in 2018. In particular, while birth rates were comparably low for patients aged 43-44 (5%) and patients above 44 (4%) using their own eggs, patients above 44 years were three time more likely to use donor eggs.
Of all patients undergoing IVF treatment in 2018, 94.4% were in heterosexual relationships, 3.1% were in female same-sex relationships, 2.0% had no partner and 0.5% acted as surrogates – with little change compared to 2017. While accounting for less than 5.5% of all IVF treatments, single patients, those in female same-sex relationships and surrogates accounted for 46% of all IVF cycles using donor gametes in patients under 40.
Figure 4. Donor eggs are used most by those patients over 44
Proportion of IVF cycles using donor sperm/eggs by age band, 2018
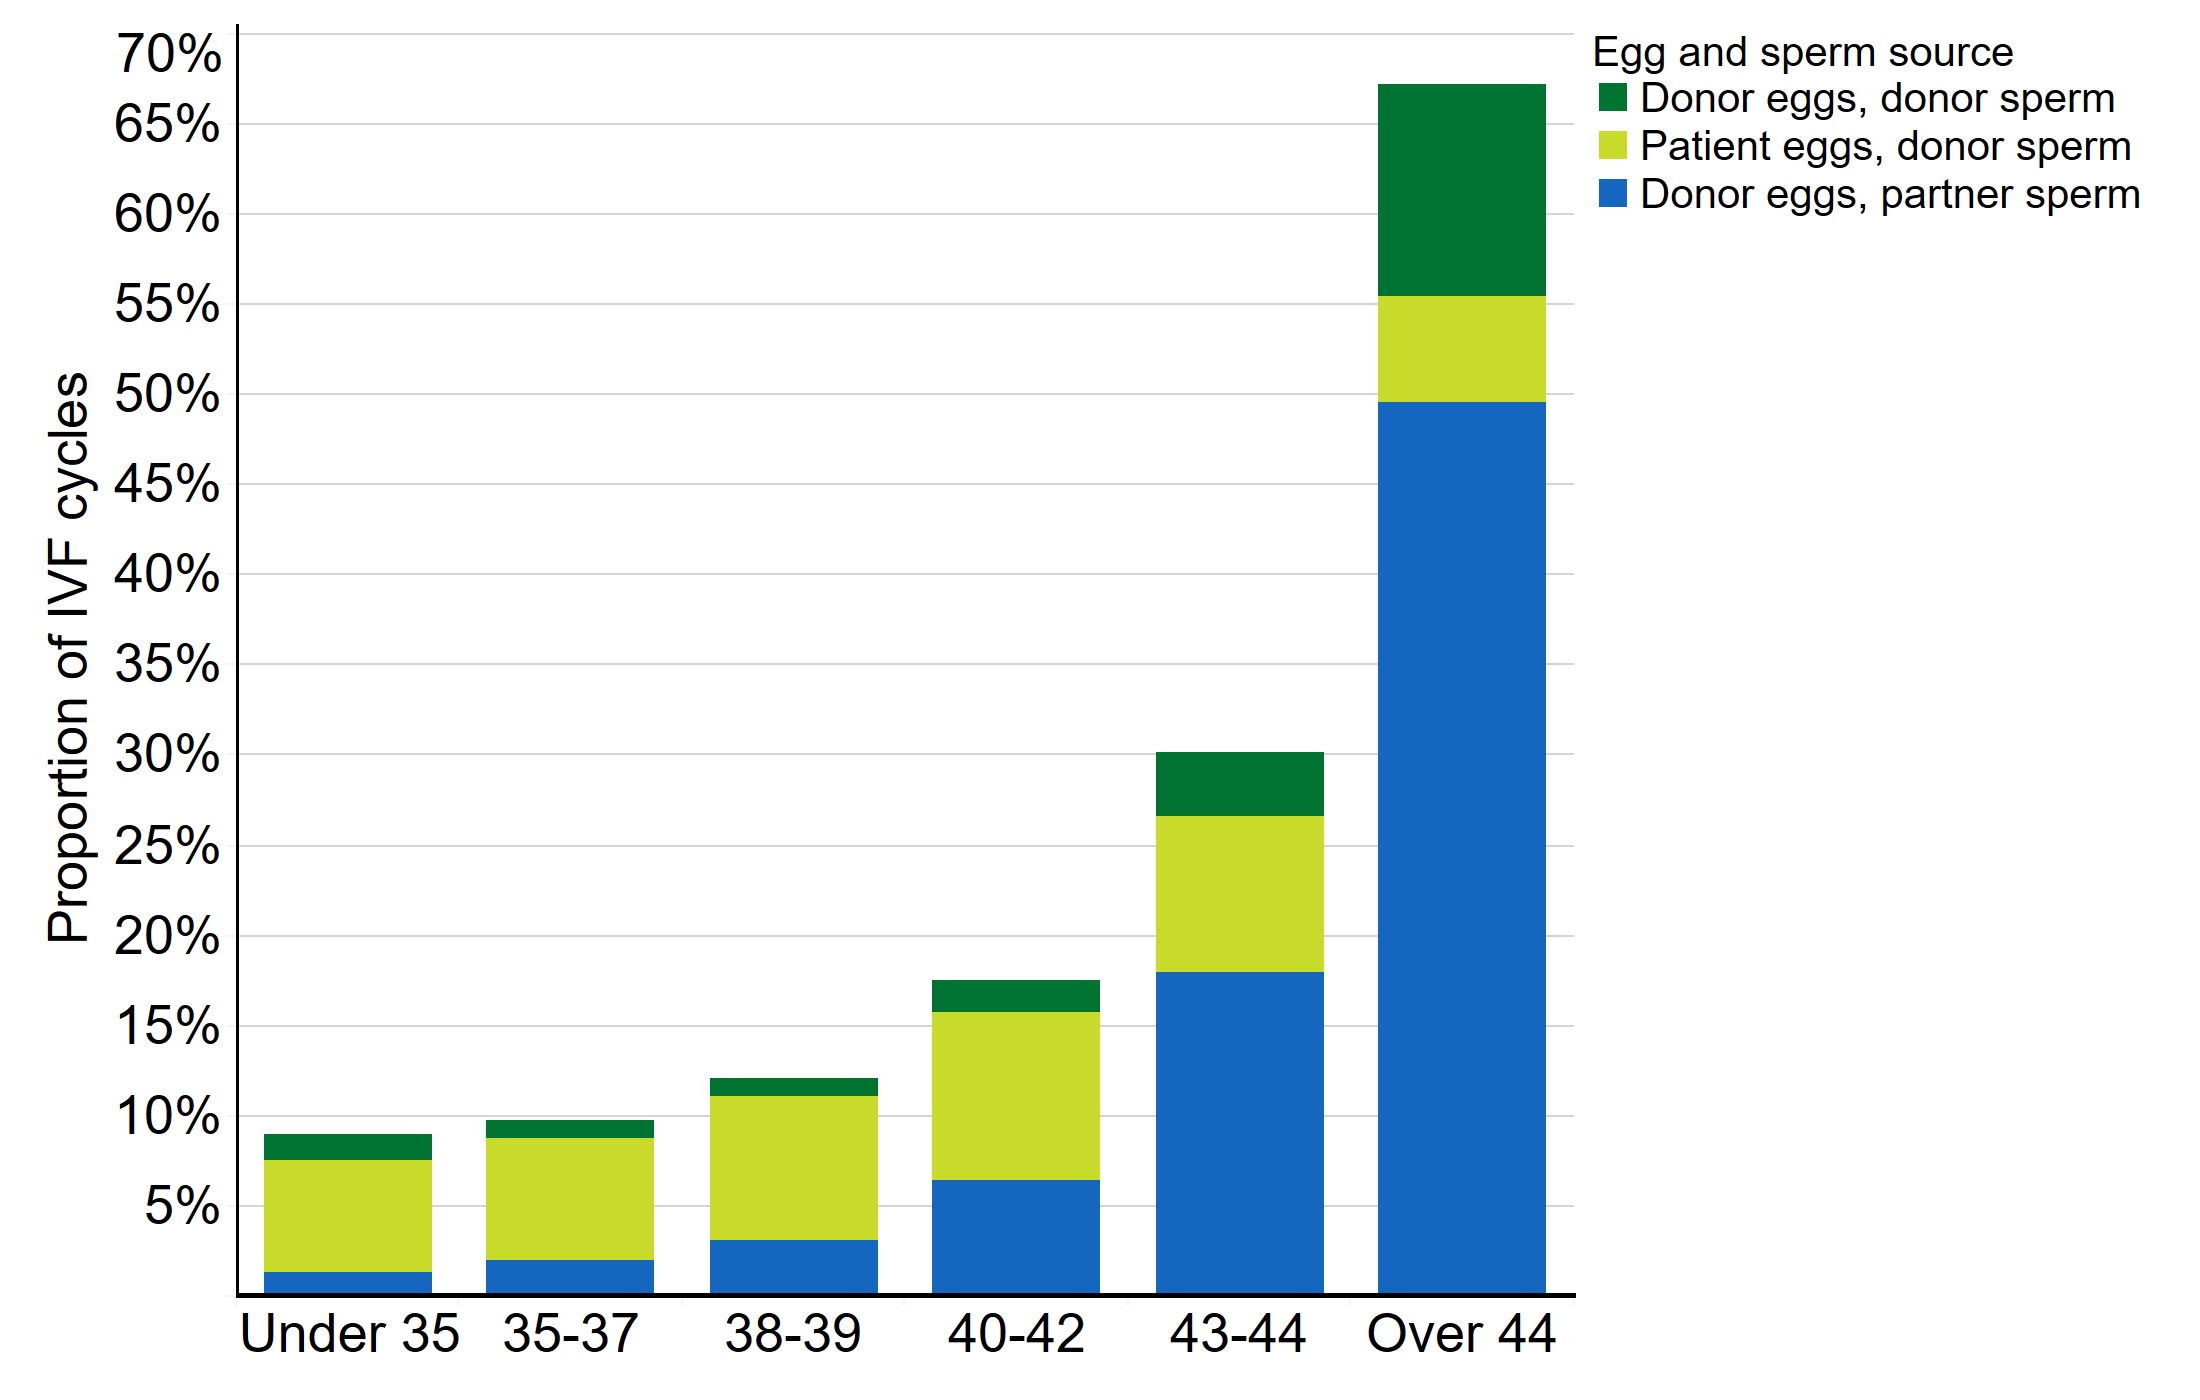
Figure 4 Note: This data includes treatment now and IVF only.
Download the underlying data for Figure 4 as .xlsx (154KB)
If you require the data for Figure 4 in an alternative accessible format, please email comms@hfea.gov.uk.
4. The multiple birth rate decreased further to 8% in 2018
Multiple births are the biggest single health risk from IVF to mothers and babies. In 2017, the 10% multiple birth rate target was achieved for the first time nationally, but not across all age groups. In 2018, further progress was made, as the 10% target was reached across all age groups and nationally only 8% of IVF births resulted in a multiple birth.
Figure 5. The 10% multiple birth target has been reached in all patient age groups
Multiple birth rates by age group, 2017 and 2018
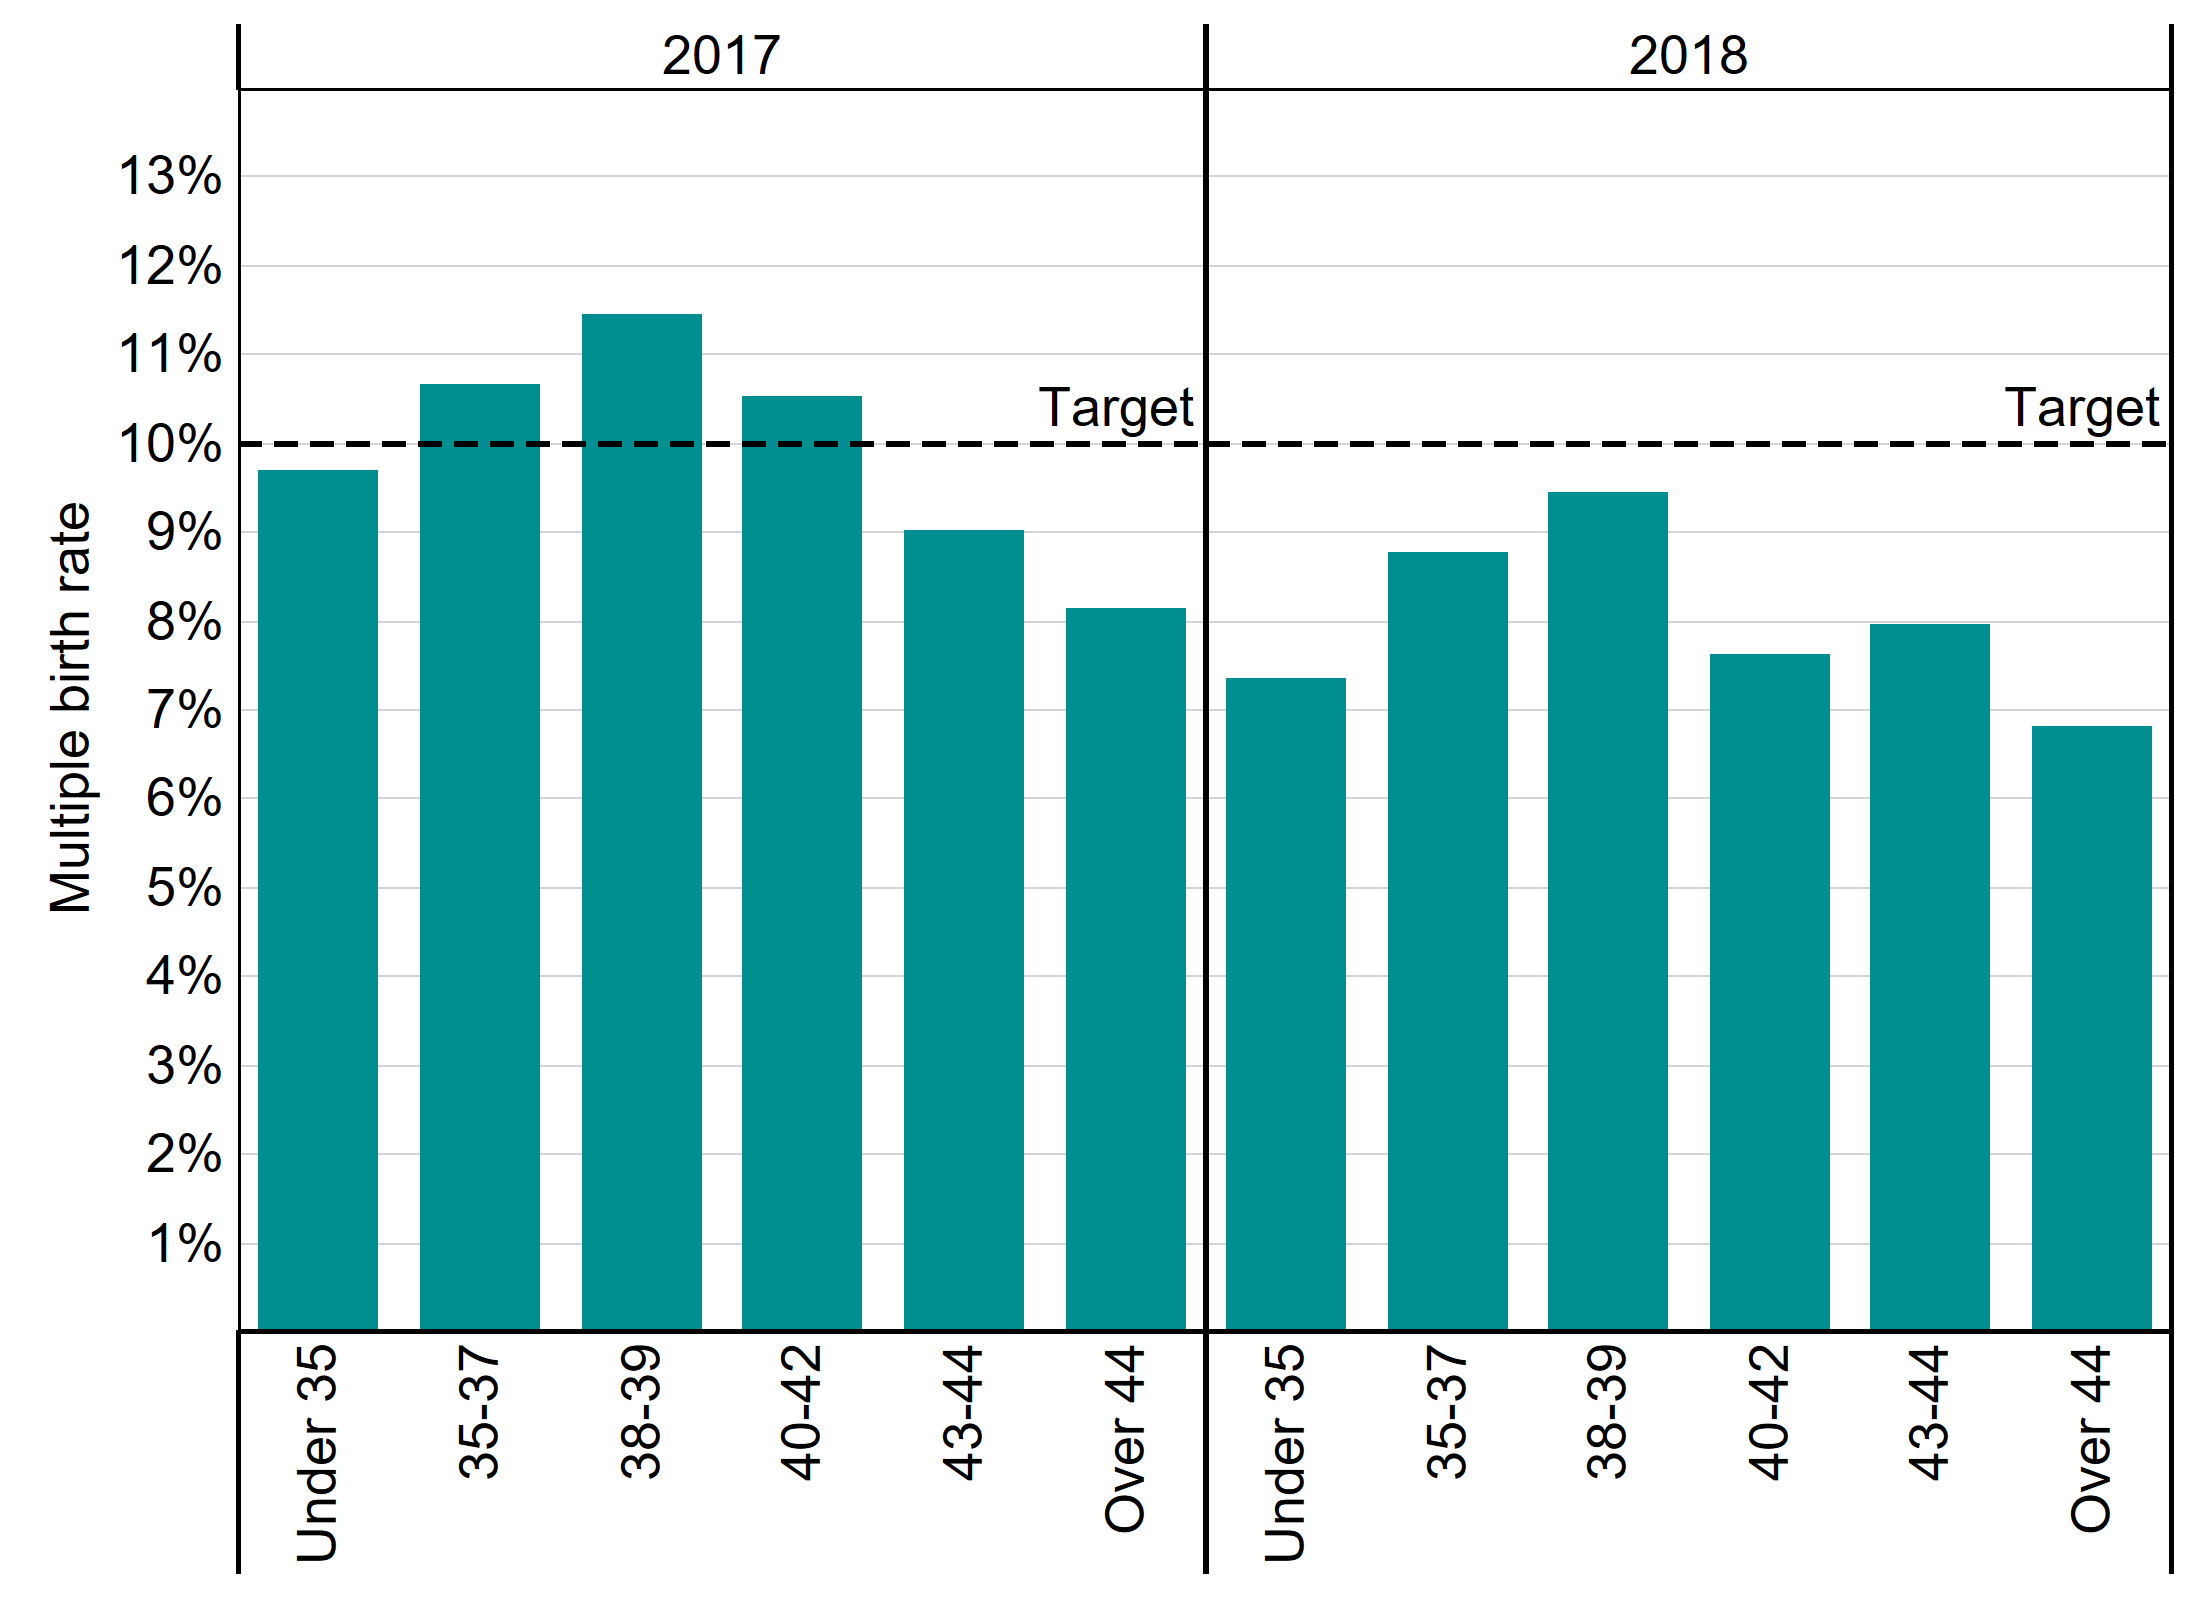
Figure 5 Note: This data includes treatment now and IVF only. It excludes cycles where pregnancy was recorded but not outcome.
Download the underlying data for Figure 5 as .xlsx (154KB)
If you require the data for Figure 5 in an alternative accessible format, please email comms@hfea.gov.uk.
5. Transferring more than one embryo could result in a multiple birth rate over 30%
For each patient, the risk of a multiple birth is determined by the number of embryos put back and whether donor eggs were used. Our figures show that putting more than one embryo back has no significant impact on the chance of a live birth but can considerably increase the risk of a multiple birth.
As the figure below shows, the risk of a multiple birth in IVF is comparable to natural conception (2%), when only a single embryo is put back. Where two embryos were transferred, however, there was a 32% risk of a multiple birth for patients under 35, without an increase in the chance of a live birth. In 2018, 21% of IVF cycles in patients under 35 had a double embryo transfer.
The decision to transfer more than one embryo at a time should also consider the egg source. When two embryos were transferred, a 44-year-old patient using donor eggs had almost the same multiple birth risk as a 35-year-old using their own eggs. Of all cycles using donor eggs in patients 40 and over in 2018, 18% transferred back more than one embryo.
Figure 6. Single embryo transfers are the safest option for patients of all ages
Multiple birth rate by egg source and number of embryos transferred, UK, 2018
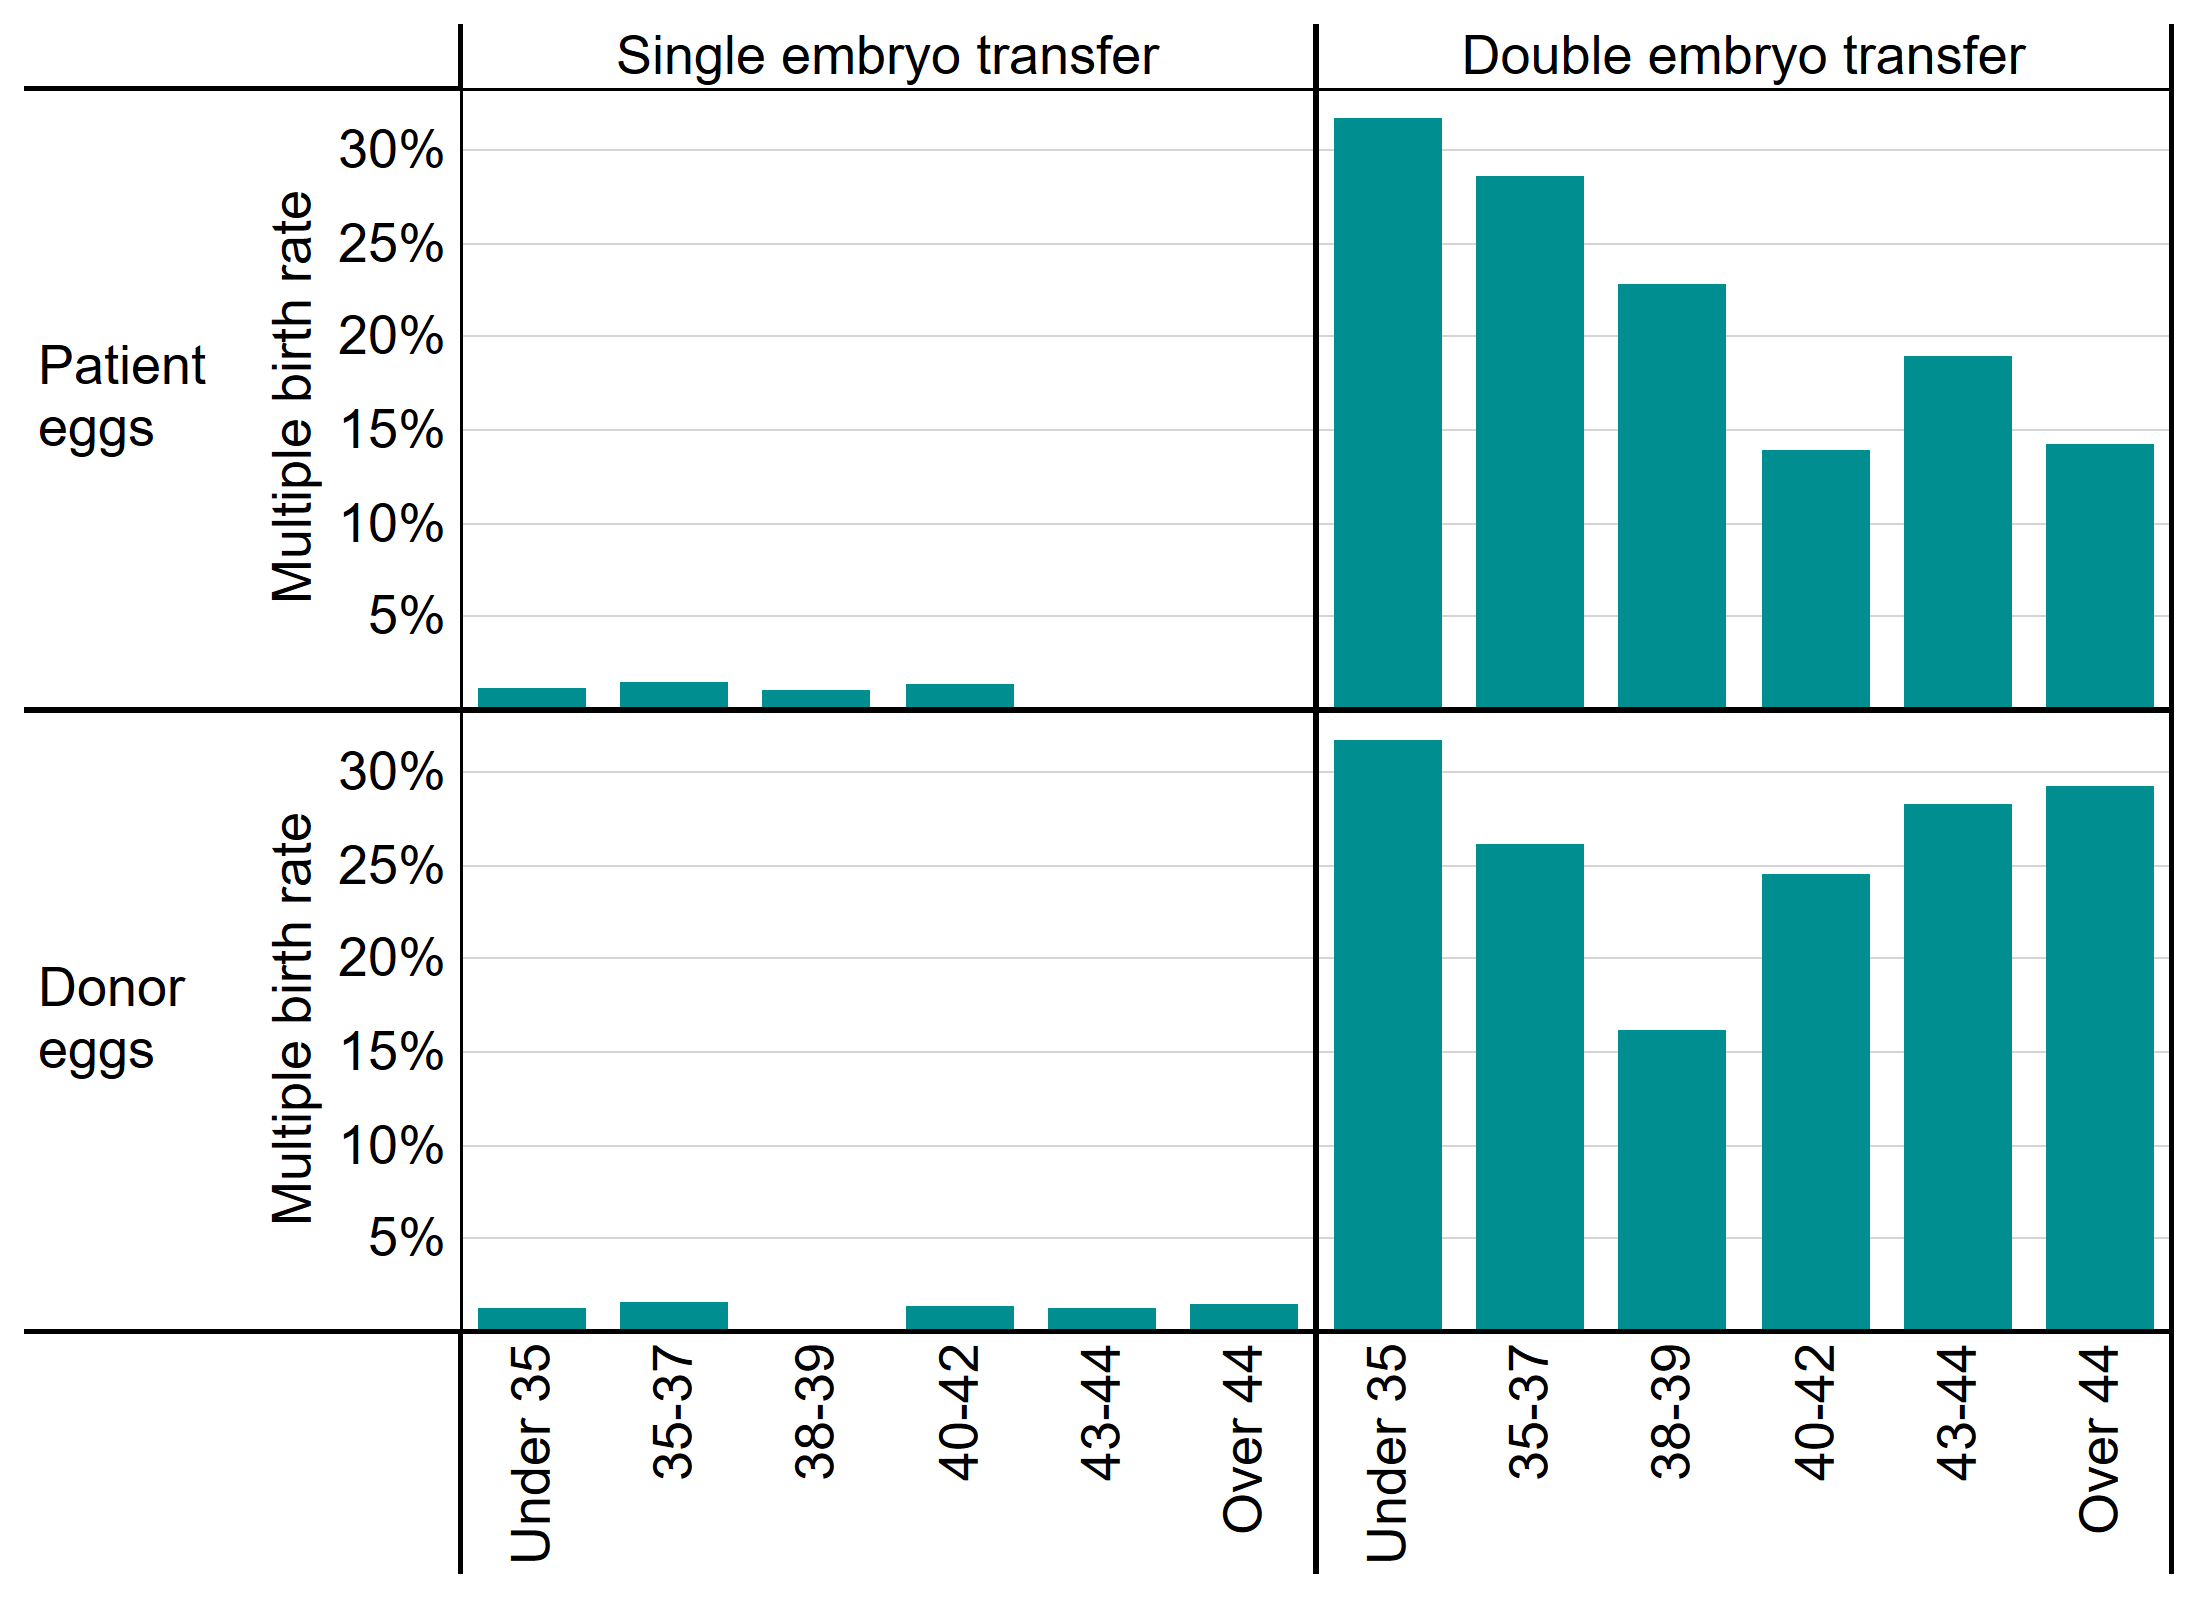
Figure 6 Note: This data includes treatment now and IVF only. It excludes cycles where pregnancy was recorded but not outcome.
Download the underlying data for Figure 6 as .xlsx (154KB)
If you require the data for Figure 6 in an alternative accessible format, please email comms@hfea.gov.uk.
6. Embryo and egg storage have increased as freezing becomes more common
The majority of patients using fertility services do so with the intention of trying to conceive as soon as possible. However, there are other reasons people may use fertility services: to store their eggs and/or embryos for future use for fertility preservation; or to donate their eggs, sperm or embryos for use by another patient. While treatment cycles increased by 12% between 2013 and 2018, storage cycles increased much more rapidly, increasing by 523% from 1,500 cycles in 2013 to just under 9,000 in 2018.
As freezing techniques have improved, a typical patient today will have a single, fresh embryo transferred in their first cycle and any additional embryos created will be stored for use in subsequent frozen embryo transfers. Elective freeze-all cycles – where all fresh embryos are frozen after IVF to be used in later cycles – have also become more common. As a result, fresh embryo transfers decreased by 11% between 2013 and 2018, while frozen embryo transfers almost doubled and accounted for 38% of all IVF cycles in 2018.
Table 1. Egg and embryo storage as well as frozen embryo IVF cycles are the fastest growing activities
| 2013 | 2018 | % change | |
|---|---|---|---|
| Fresh embryo transfer | 48,391 | 42,835 | -11% |
| Frozen embryo transfer | 13,421 | 25,889 | +93% |
| Donor insemination | 4,642 | 5,651 | +22% |
| Treatment total | 66,454 | 74,375 | +12% |
| Embryo storage | 871 | 7,031 | +707% |
| Egg storage | 569 | 1,933 | +240% |
| Storage total | 1,440 | 8,964 | +523% |
| Donation | 1,393 | 1,916 | +38% |
| Egg share | 765 | 381 | -50% |
| Donation total | 2,158 | 2,297 | +6% |
Download the underlying data for Table 1 as .xlsx (155KB)
If you require the data for Table 1 in an alternative accessible format, please email comms@hfea.gov.uk.
7. NHS-funded cycles decreased in many English regions
In 2018 in Scotland, 60% of treatment was NHS-funded, compared to 45% in Northern Ireland, 41% in Wales and 35% in England. In Scotland, Wales and Northern Ireland, the level of funding is set nationally. In England, funding is locally determined by Clinical Commissioning Groups (CCGs) leading to considerable regional variation in funding, as seen in the table below. In England, many CCGs have reduced funding for fertility treatment and as a result, the share of IVF cycles funded by the NHS has declined across most regions. The biggest decreases were seen in the East of England as well as Yorkshire and the Humber, decreasing the England-wide share to 35% (41% in 2013).
Table 2. Funding trends are diverging nationally and regionally, with the overall number of NHS funded cycles declining
| UK nation | % of cycles funded by NHS | ||
|---|---|---|---|
| IVF cycles in 2018 | 2013 | 2018 | |
| England | 59,153 | 41% | 35% |
| London | 22,406 | 29% | 27% |
| North West England | 8,319 | 51% | 55% |
| South East England | 7,521 | 42% | 32% |
| West Midlands | 4,370 | 47% | 40% |
| Yorkshire and Humber | 3,961 | 45% | 26% |
| East Midlands | 3,569 | 37% | 34% |
| East of England | 3,748 | 55% | 26% |
| South West England | 2,943 | 50% | 41% |
| North East England | 2,316 | 60% | 60% |
| Scotland | 5,060 | 51% | 60% |
| Wales | 2,689 | 23% | 41% |
| Northern Ireland | 1,853 | 45% | 45% |
Table 2 Note: This data includes treatment now and IVF only
Download the underlying data for Table 2 as .xlsx (155KB)
If you require the data for Table 2 in an alternative accessible format, please email comms@hfea.gov.uk.
8. Fewer patients had their first IVF cycle funded by the NHS
As discussed in section 7, many English regions have seen a decrease in the proportion of treatments funded by the NHS. As a result, approximately 2,000 fewer patients had their first round of treatment funded by the NHS in 2018 compared to 2017, while treatments in the private sector continued to grow. In 2018, 52% of first IVF cycles were funded by the NHS, compared to 58% in 2017.
Figure 7. First cycles are most likely to be NHS funded, but this has decreased over time
Number of cycles by funding type and cycle number, UK, 2009-2018
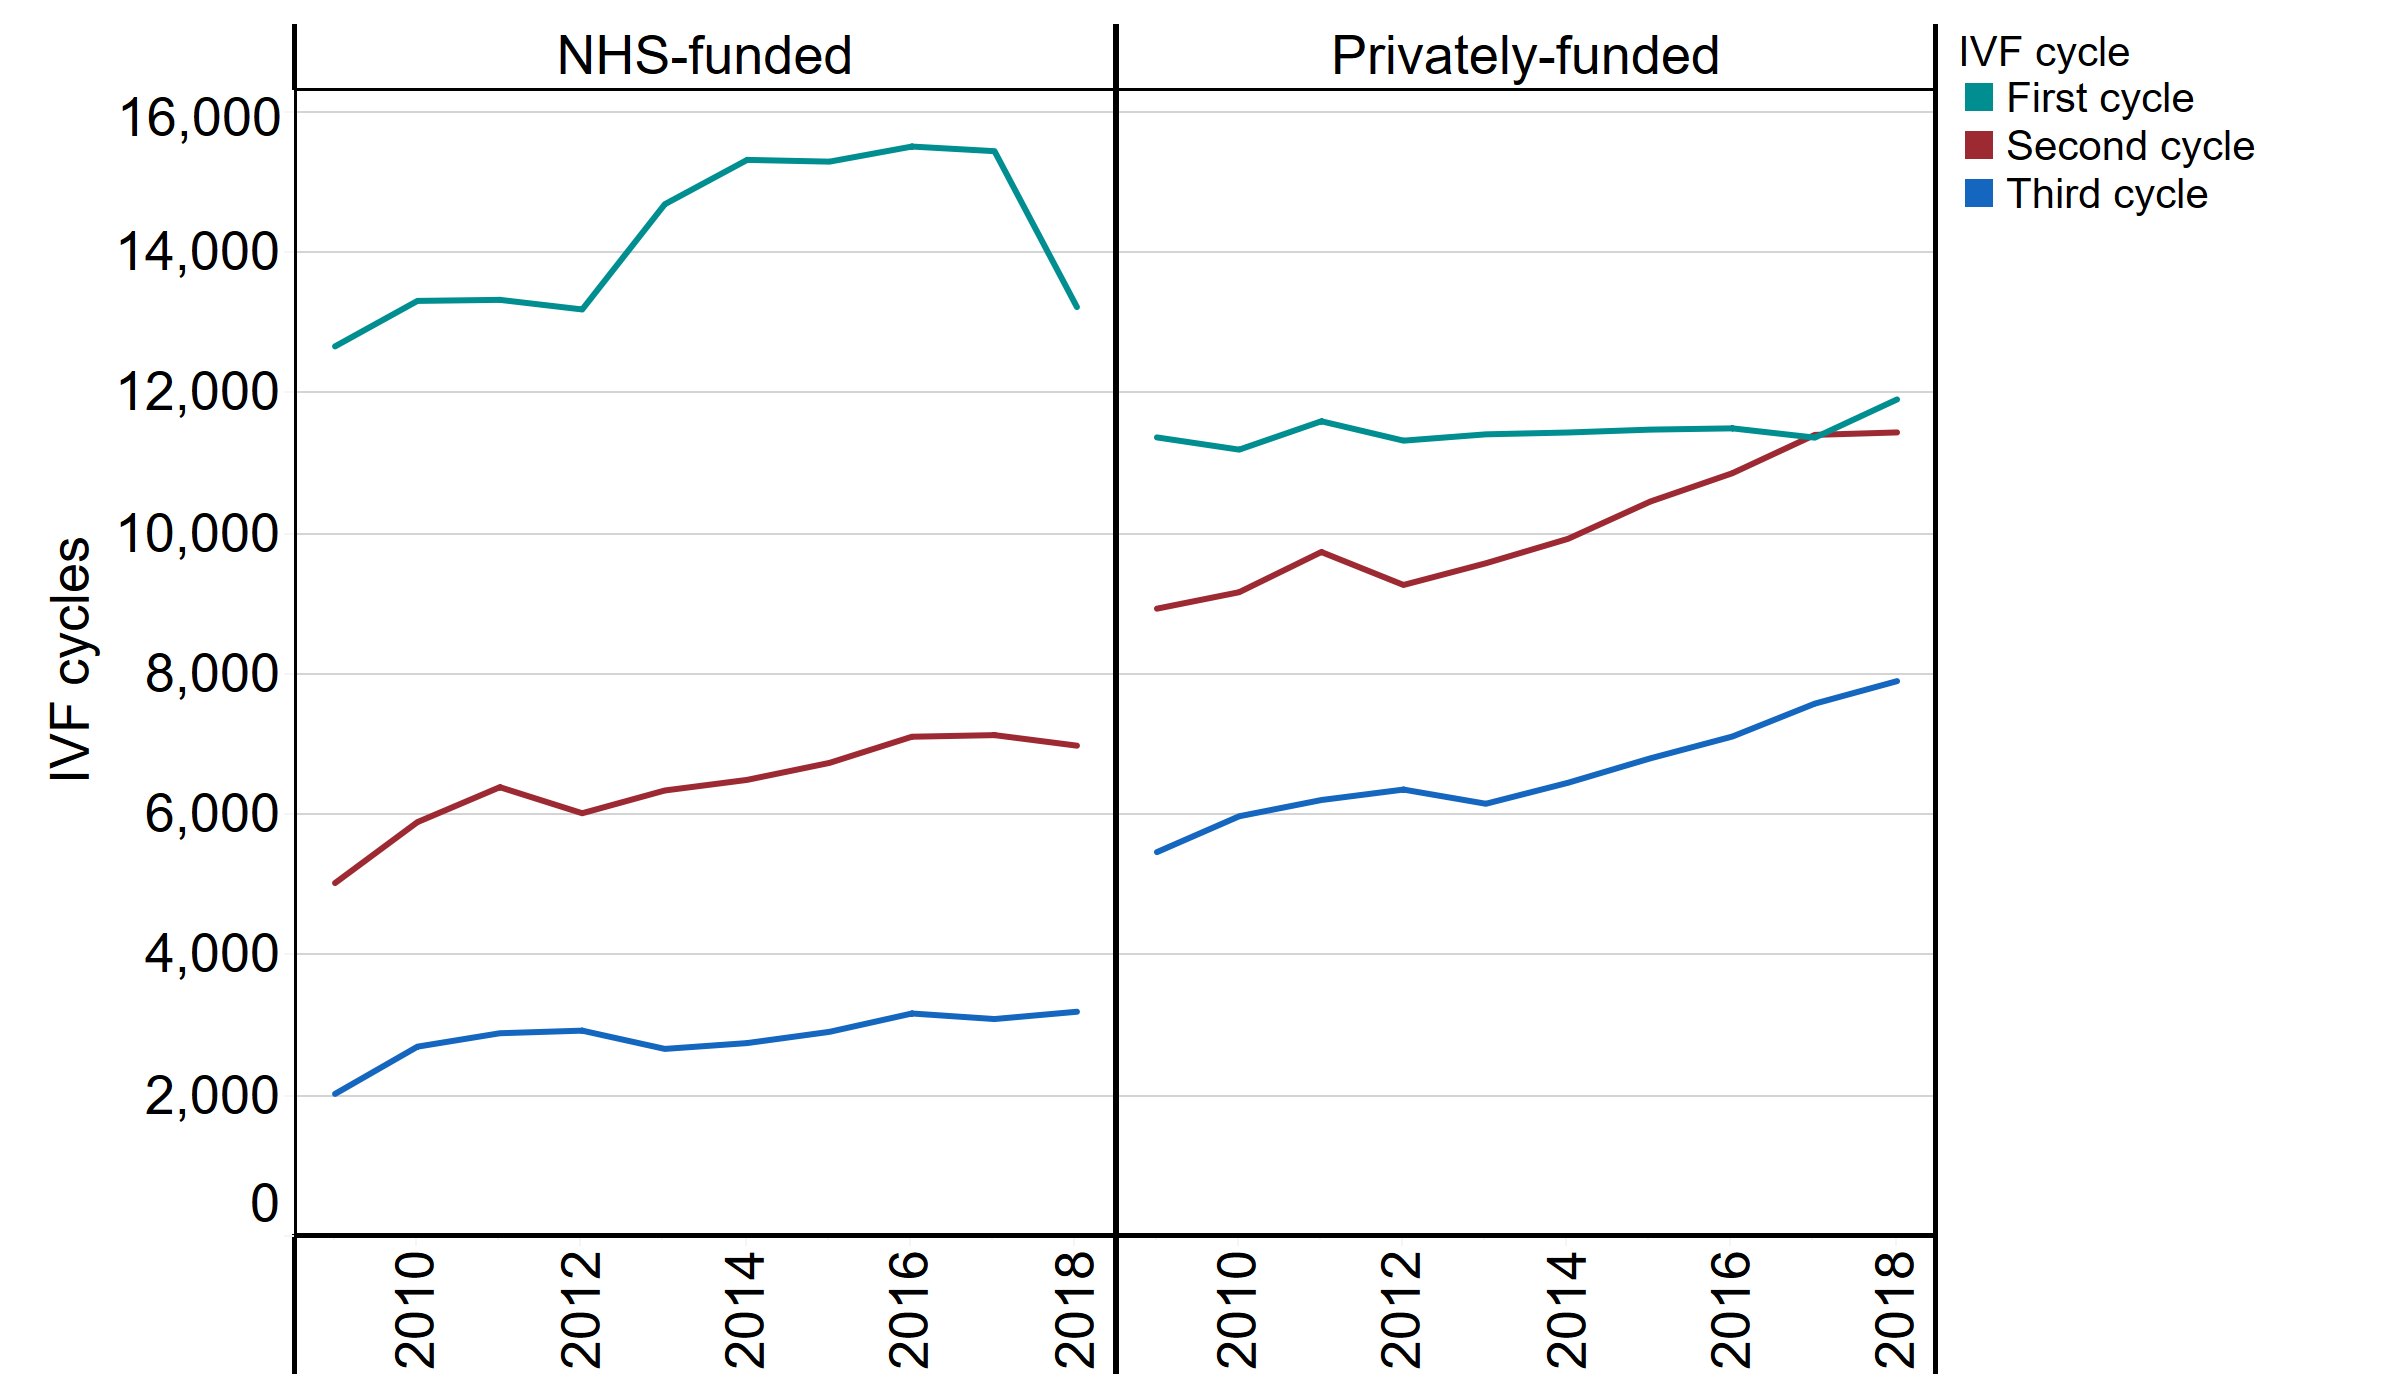
Figure 7 Note: This data includes treatment now and IVF only
Download the underlying data for Figure 7 as .xlsx (152KB)
If you require the data for Figure 7 in an alternative accessible format, please email comms@hfea.gov.uk.
About our data
The information that we publish is a snapshot of data provided to us by licensed clinics. The figures supplied in this report are from our data warehouse containing Register data as at 07/01/2020. We have excluded approximately 850 cycles due to technical issues at one centre that resulted in reporting errors. Results are published according to the year in which the cycle was started. For further information, please see our quality and methodology report.
Contact us regarding this publication
Media: press.office@hfea.gov.uk
Statistical: intelligenceteam@hfea.gov.uk
| Publication date: |
|---|