
 Read our new report
Fertility Trends
Choose a Fertility Clinic Consultation
The Human Fertilisation and Embryology Authority (HFEA) is seeking views on the main profile page statistics on each licensed clinic’s Choose a Fertility Clinic profile page.
This consultation has closed.
To review the findings of this consultation, please click here.
Introduction
The HFEA provides information to patients and the wider public in many ways, including through the Choose a Fertility Clinic (CaFC) function on our website, which has information about UK licensed fertility clinics.
The CaFC information is not a tool to predict an individual patient’s chance of having a baby but shows data about treatment outcomes and other information for each UK licensed clinic.
How can we measure success from IVF?
There are different ways to measure success in fertility treatments and each of these have different benefits and drawbacks.
Although there is no agreed single statistic, there are some things that are helpful for people looking for information from clinics:
- There should be as few headline statistics as possible
- Any statistic should be easy to understand
- Statistics should allow for clear comparison across clinics
- Statistics should be representative of most treatments provided in any clinic.
Why consult on the clinic profile statistics
Choose a Fertility Clinic (CaFC) was last reviewed in 2016-17 after consultation and testing. The clinic profile page statistics agreed then were:
-
Birth per embryo transferred shows the percentage of the total number of embryos transferred that led to a birth. This can include fresh or frozen embryo transfers separately or both.
Births per embryo transferred is calculated using the number of “birth events” (meaning twin or triplet births would only be counted once) divided by the number of embryos transferred, shown as a percentage, in a clinic over a 12-month period.
-
Births per egg collection shows the percentage of egg collection procedures that led to a birth. Because of the way births per egg collection procedure is calculated, it includes both fresh and frozen embryo transfers from the same egg collection procedure.
Births per egg collection procedure is calculated by using the number of “birth events” (meaning twin or triplet births would only be counted once) divided by the number of egg collection procedures, shown as a percentage. This is calculated using all the egg collection procedures that took place in a clinic over a 12-month period and includes any births from those egg collection procedures over a period of two years.
- Multiple births (e.g. twins or triplets) – the total number of multiple birth events divided by the total number of birth events.
The fertility sector has changed significantly since these statistics were published and so it is a good time to ask what the most useful clinic profile page statistics are to use moving forward.
In May 2025 we published three interim statistics:
- Live birth rate per embryo transferred – the “‘combined rate”’ taking account of all IVF treatment split under and over aged 38.
- Live birth rate per embryo transferred – the “‘fresh rate’” comprising only fresh, stimulated IVF using own eggs split under and over aged 38.
- Multiple birth rates split under and over aged 38.
The changes in the UK fertility sector since 2016-17:
The balance of fresh and frozen embryo cycles has changed
Typically, an IVF patient today will have a single fresh embryo transferred in their first cycle, and any additional suitable embryos frozen for later use. There are now more frozen embryo cycles compared to previous years (Fertility treatment 2023: trends and figures). However, this differs between clinics, with some clinics doing more frozen embryo transfers than others.
The continuing importance of patient age and the use of donor eggs
One factor that has remained largely constant since 2016-17 is the importance of patient age on the chance of having a baby.
Figure 1. Average fresh embryo transfer IVF birth rate per embryo transferred using patient eggs by age group, 1991-2023.
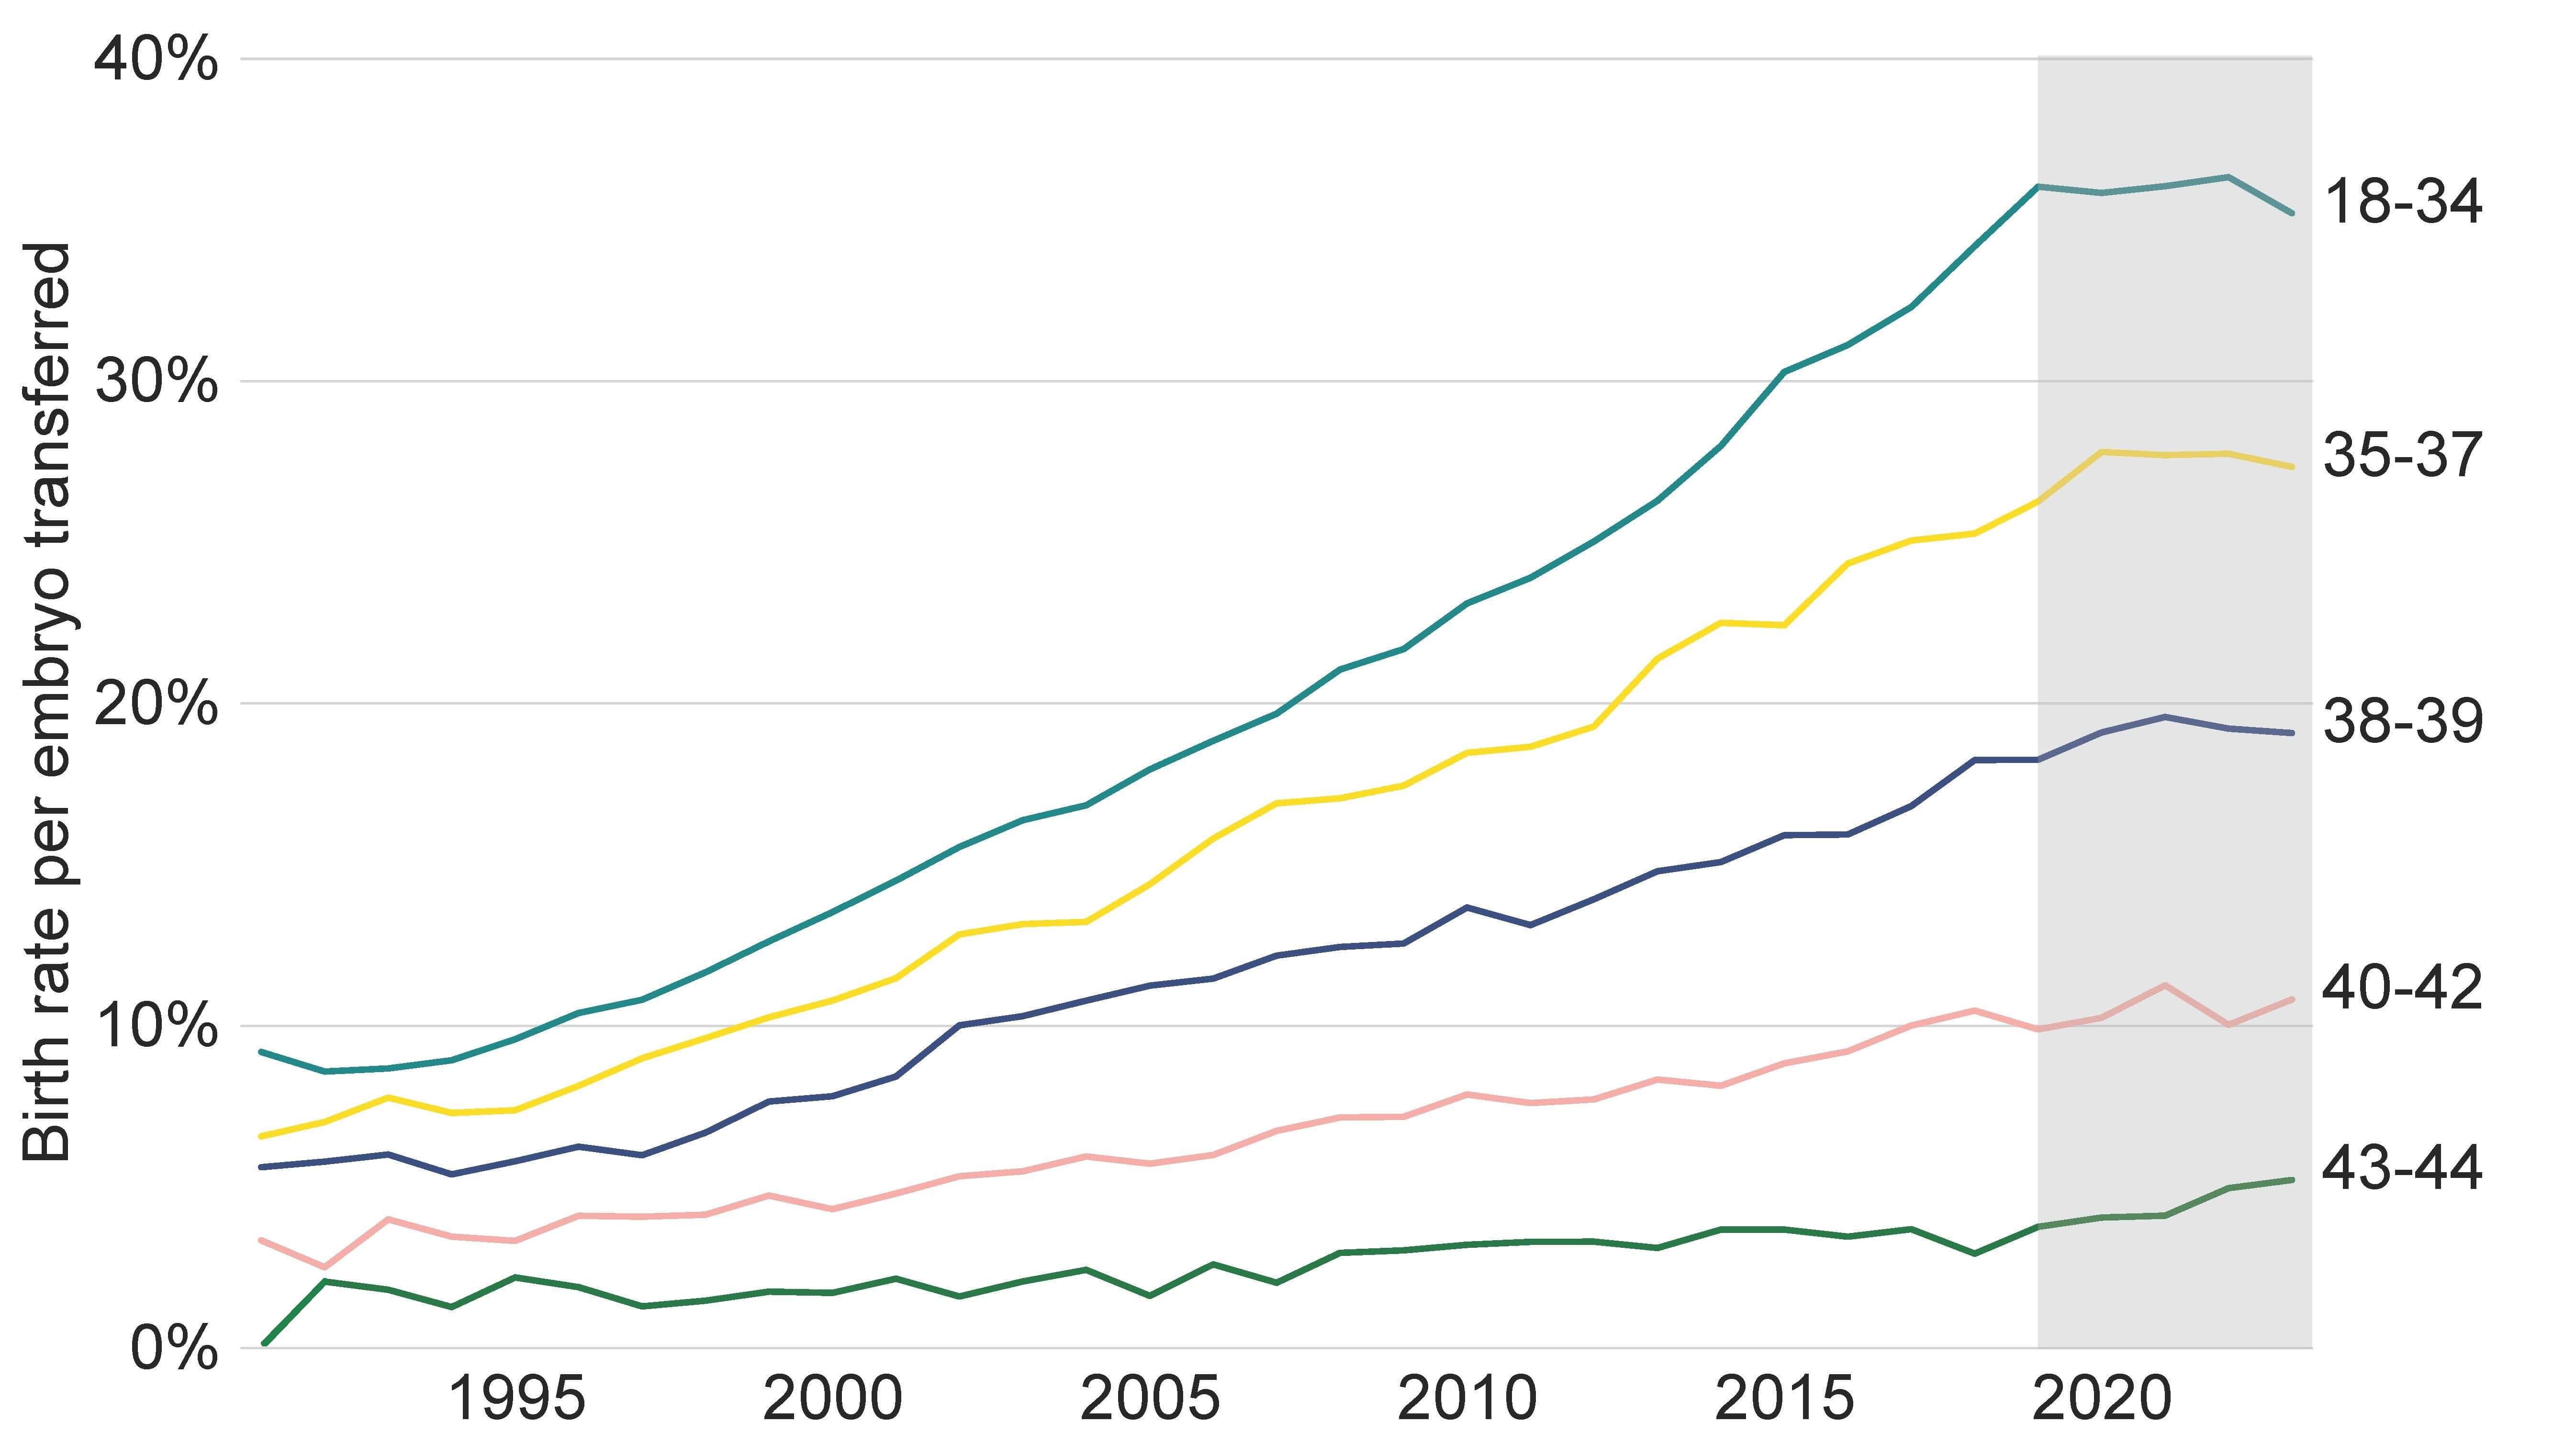
Figure 1 source: Fertility treatment 2023: trends and figures.
Although the proportion of IVF cycles using donor eggs remained consistent between 2016 and 2023 (around 6%), in 2023 some clinics performed up to 31% of IVF treatment cycles using donor eggs.
The chance of having a baby with IVF using donor eggs is generally higher compared to IVF using a patient’s own eggs. This is because egg donors are typically younger than the IVF patients using them and are unlikely to have fertility issues.
If donor eggs are included in the rate along with treatments with a patient’s own eggs, clinics that undertake more donor treatment than the national average may show an inflated success rate, which makes fair comparisons across clinics more difficult.
The growth in cycles that use PGT-A in some clinics
PGT-A involves checking embryos for abnormalities in the number of chromosomes, as embryos that appear to have missing or extra chromosomes have less chance of developing into a baby. PGT-A is done on fresh embryos and, while tests are being done, the embryos are frozen for transfer later once results are ready. Patients having embryos transferred with a normal chromosome number may, therefore, have a higher chance of having a baby from that particular embryo, as it may reduce the chance of a miscarriage. However, PGT-A often reduces the number of embryos available for transfer and may mean that there are no embryos to transfer.
PGT-A is classified as a treatment add-on by the HFEA as evidence shows that, for most patients, PGT-A does not improve the chances of having a baby.
In 2016, 1% of IVF treatment cycles involved PGT-A. In 2023, almost 3% of all IVF treatment cycles were PGT-A, though in a minority of clinics almost half of their IVF treatment cycles use PGT-A.
The use of PGT-A in the UK is increasing and, when combined with a technique known as ‘batching cycles’ (where the patient undergoes several cycles before an embryo is transferred), this is likely to distort the reliability of birth per embryo transferred as a fair measure of clinic performance as it does not reflect patients who may start a cycle of treatment, undergo PGT-A, and don’t have an embryo to transfer. Therefore, if PGT-A cycles are included in the births per embryo transferred calculation, clinics that undertake more PGT-A may show an inflated success rate, which could make comparisons across clinics more difficult.
Multiple births have decreased
In 2016-17, 11% of cycles in clinics led to a multiple birth (twins and triplet pregnancies). In 2023, the multiple birth rate was under 4% (Fertility treatment 2023: trends and figures). However, there are still a small number of clinics with significantly higher multiple birth rates and statistics on twin and triplet pregnancies will continue to appear on a clinic’s CaFC profile page.
Figure 2. IVF multiple birth rate reduced further to 3.4% in 2023.
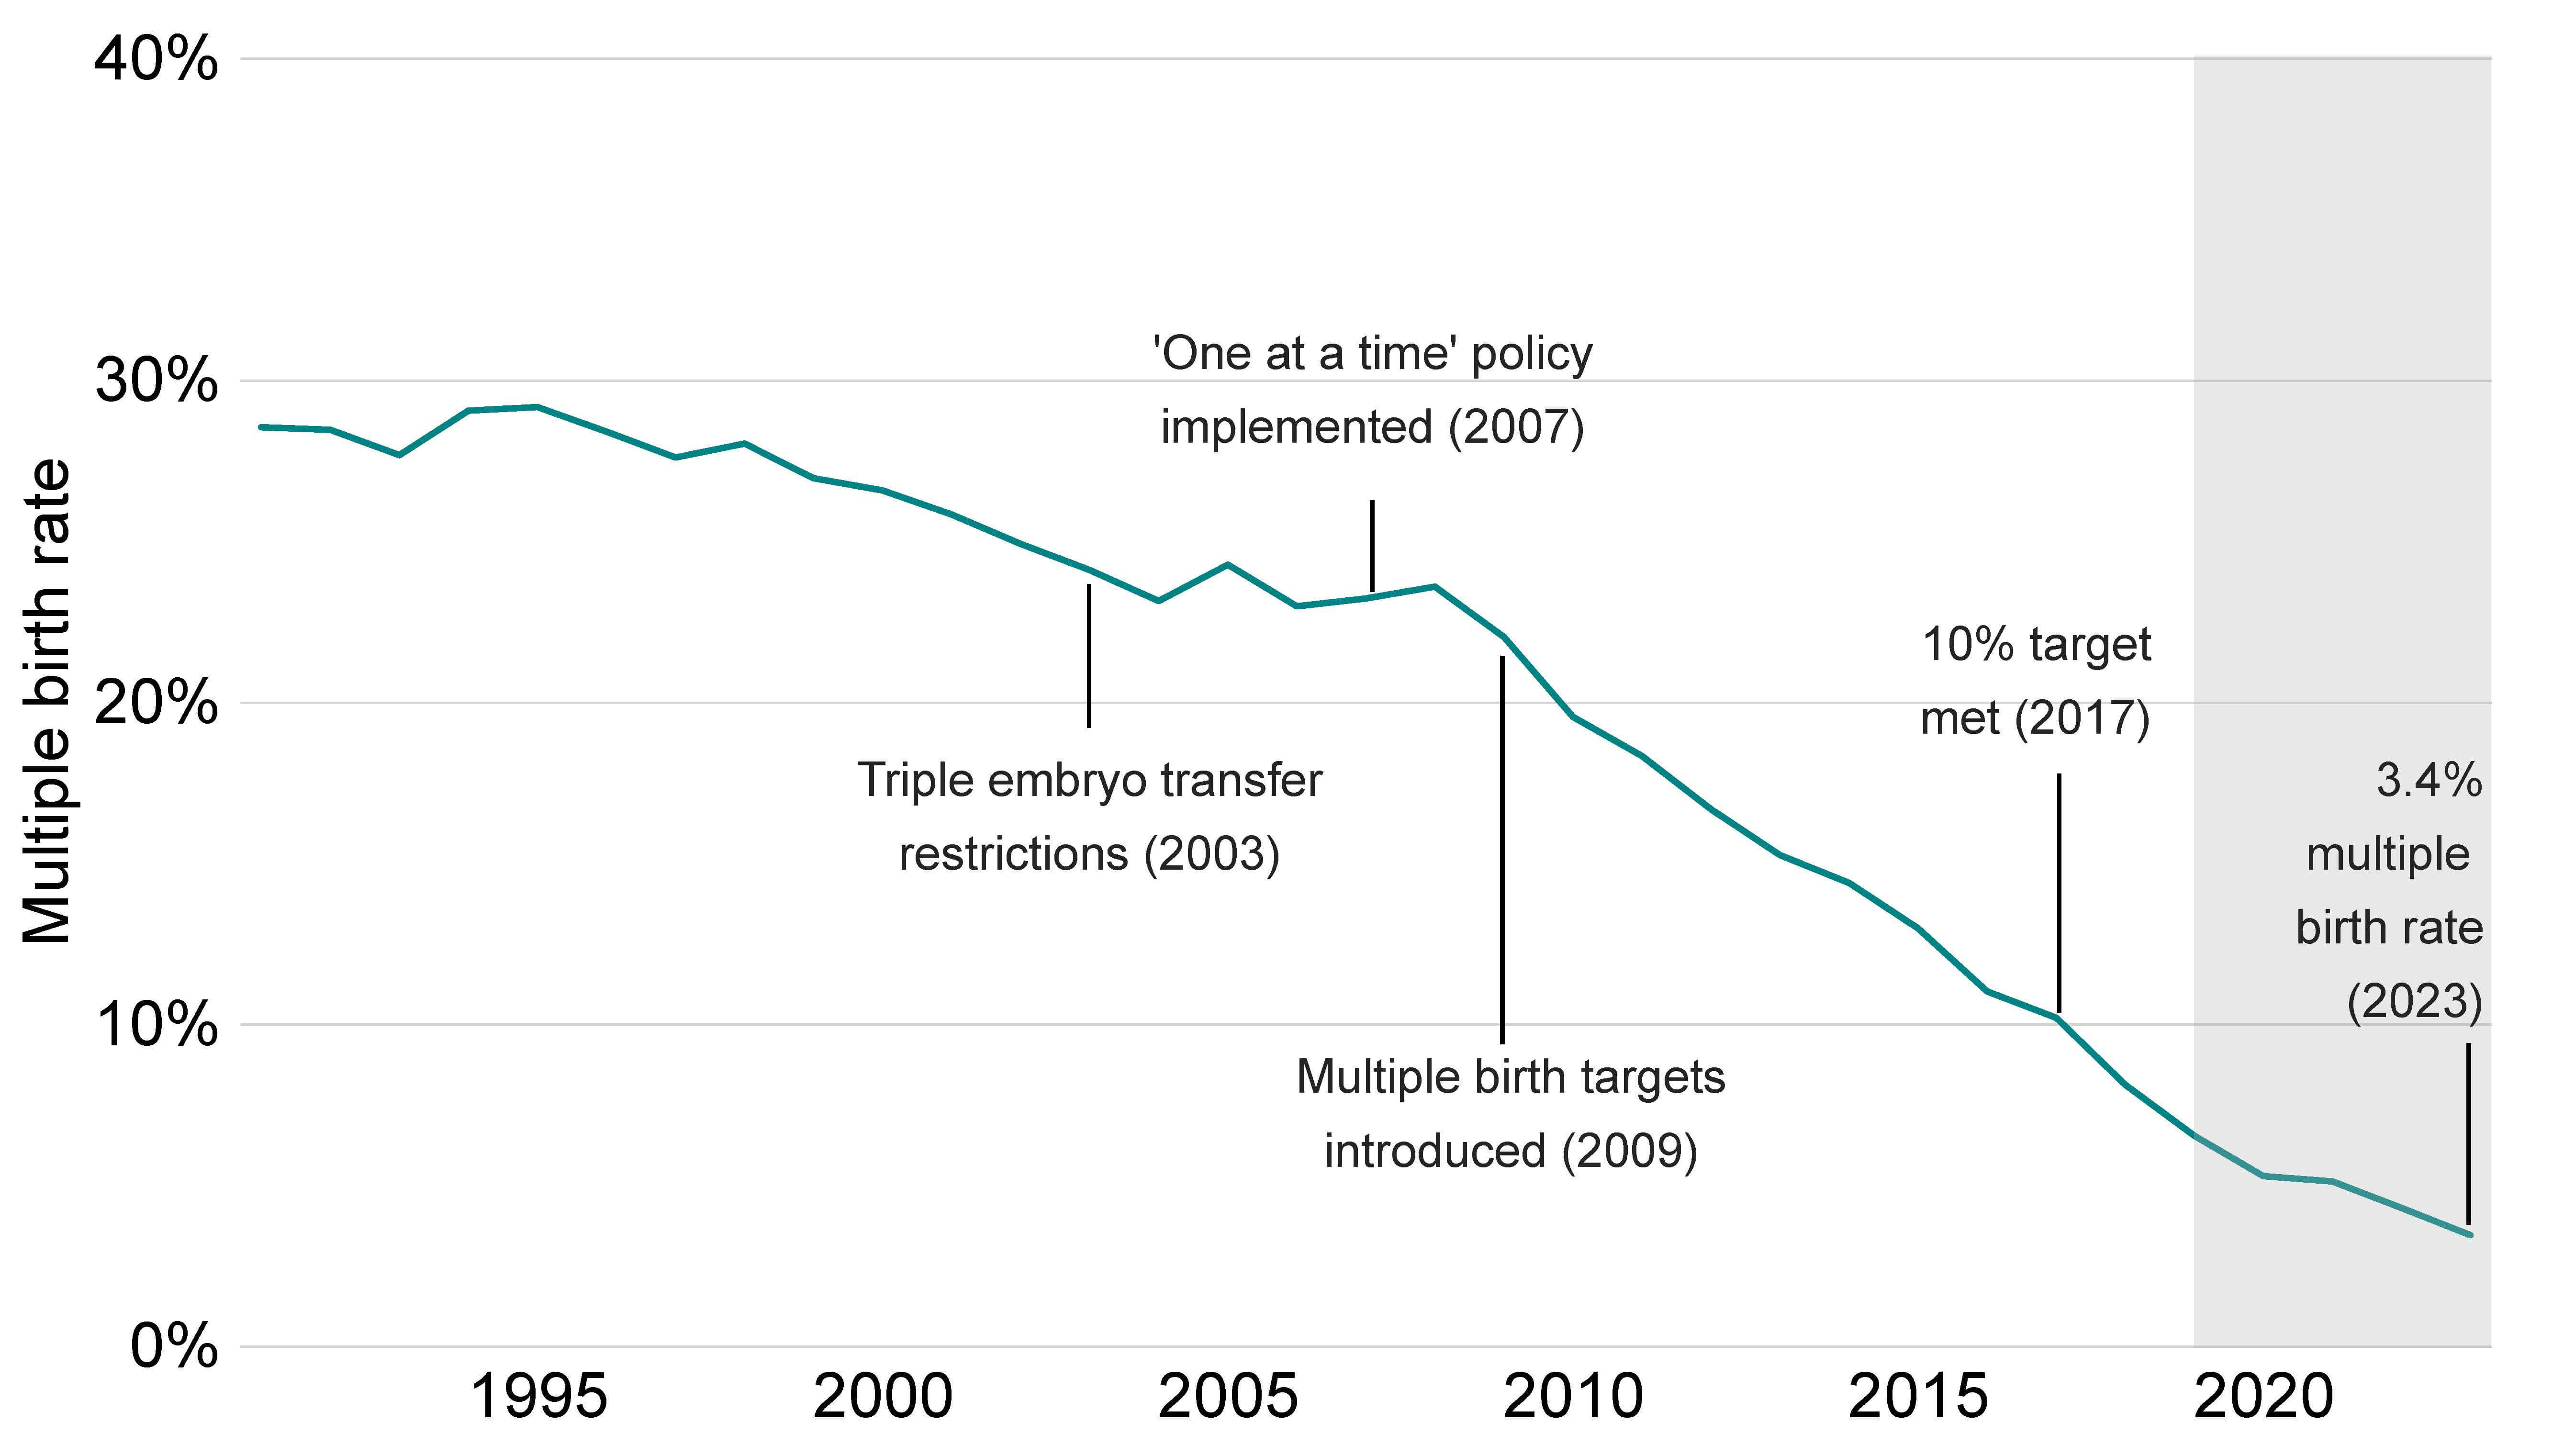
Figure 2 source: Fertility treatment 2023: trends and figures.
A clinic’s main profile page statistic
There are lots of different ways of showing a clinic’s main profile page statistics. Different statistics include different stages of the treatment journey, these are summarised below:
| Births per cycle started | Births per egg collection procedure | Births per embryo transfer procedure | Births per embryo transferred | |
| Includes ovulatory stimulation stage* | ✓ | ✕ | ✕ | ✕ |
| Includes egg collection stage* | ✓ | ✓ | ✕ | ✕ |
| Includes embryo transfer stage | ✓ | ✓ | ✓ | ✓ |
| Accounts for cases where multiple embryos are transferred in the same procedure | ✕ | ✕ | ✕ | ✓ |
| Includes multiple cycles, both fresh and frozen embryo transfers from the same egg collection (known as cumulative success rate) | ✓ | ✓ | ✕ | ✕ |
*For frozen embryo transfers, this instead refers to when embryos are thawed.
Different statistics start counting from different points in an IVF treatment cycle, this is illustrated in the figure below:
Figure 3. Calculations of a clinic’s main profile page statistic.
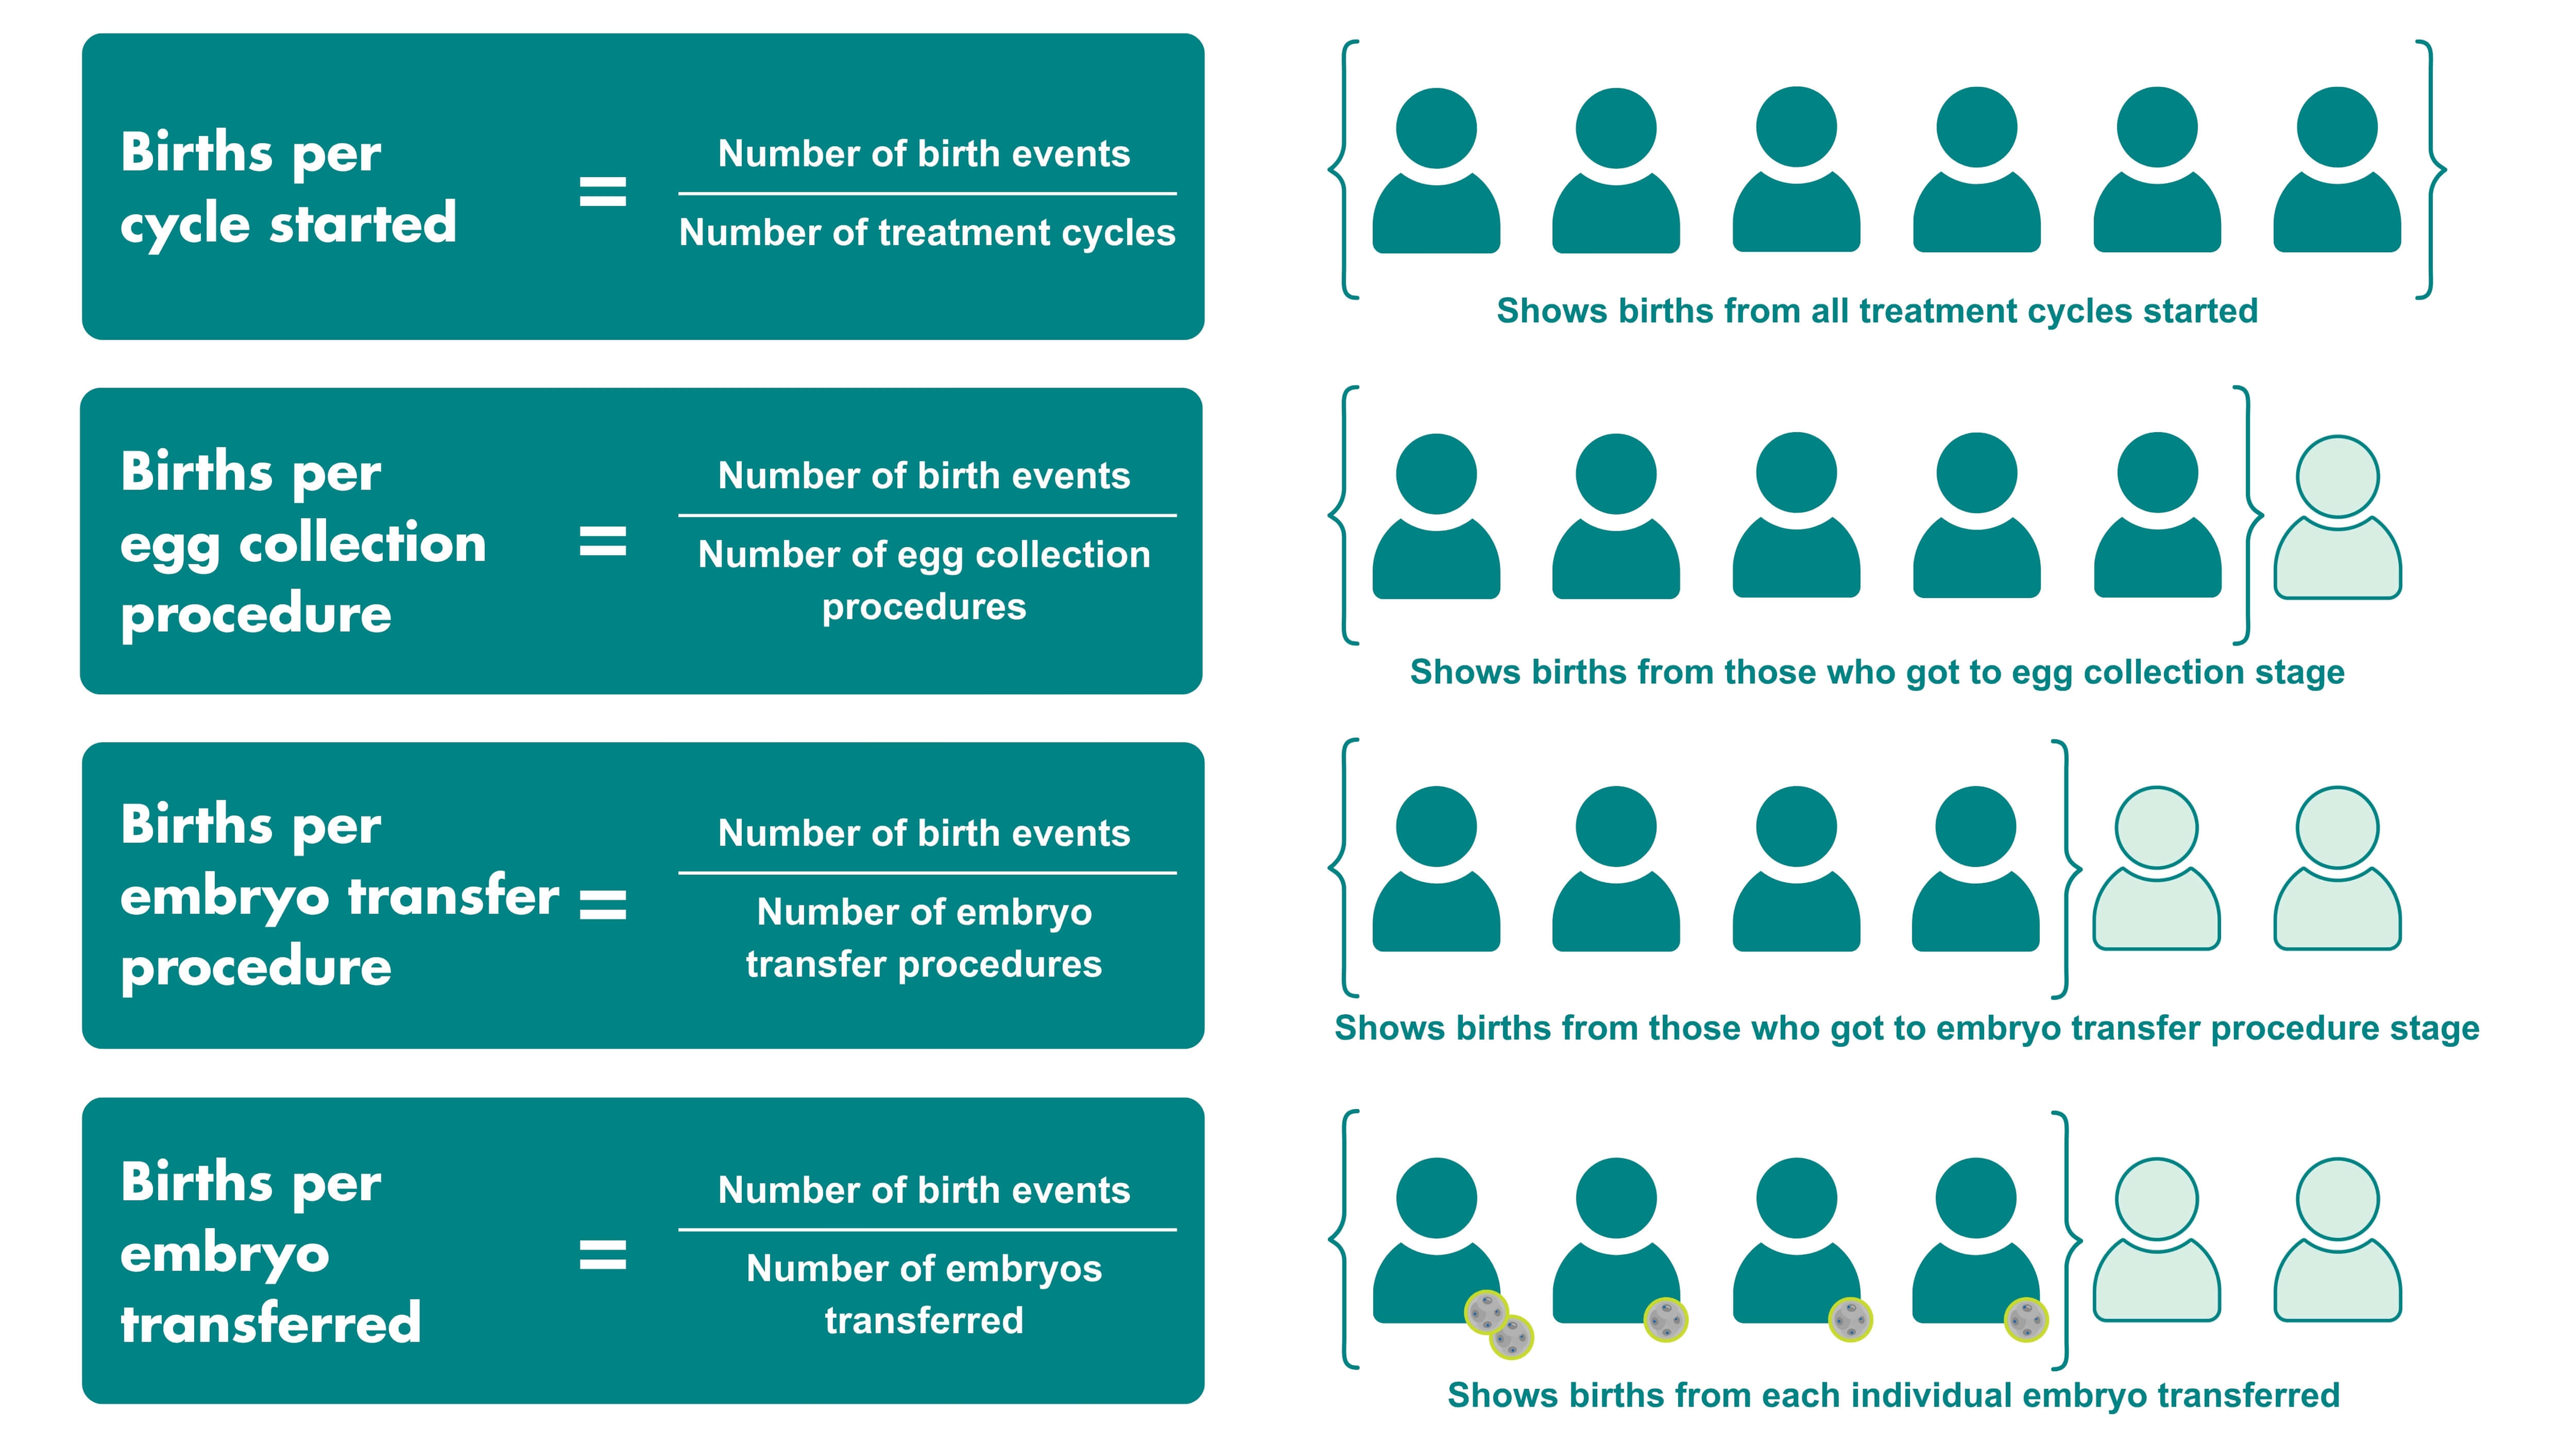
*This figure is for illustrative purposes only and is not meant to reflect actual proportions.
Further information
The data used in this page and the Fertility treatment 2023: trends and figures is from the Register as of 1 May 2025. Further information on data quality as well as the methods used to create it can be found in our Quality and Methodology report.
| Publication date: | |
|---|---|
| Last reviewed: |